Community Tip - Did you get an answer that solved your problem? Please mark it as an Accepted Solution so others with the same problem can find the answer easily. X
- Subscribe to RSS Feed
- Mark Topic as New
- Mark Topic as Read
- Float this Topic for Current User
- Bookmark
- Subscribe
- Mute
- Printer Friendly Page
Step function 1i*ln(e^[-1i*x]) - x and plotting the intersection points ?
- Mark as New
- Bookmark
- Subscribe
- Mute
- Subscribe to RSS Feed
- Permalink
- Notify Moderator
Step function 1i*ln(e^[-1i*x]) - x and plotting the intersection points ?
Hello Everyone.
From :
Need help plotting the intersection points.
Thanks in advance for your time and help.
Best Regards.
Solved! Go to Solution.
- Labels:
-
Other
Accepted Solutions
- Mark as New
- Bookmark
- Subscribe
- Mute
- Subscribe to RSS Feed
- Permalink
- Notify Moderator
- Mark as New
- Bookmark
- Subscribe
- Mute
- Subscribe to RSS Feed
- Permalink
- Notify Moderator
Hi Loi Le,
maybe you meant the discontinuity points? or what? the intersections with the axes?
Regards
FM
- Mark as New
- Bookmark
- Subscribe
- Mute
- Subscribe to RSS Feed
- Permalink
- Notify Moderator
Hi F.M.
On my side, any of them. (the purple points, the above)
Best Regards.
Loi
- Mark as New
- Bookmark
- Subscribe
- Mute
- Subscribe to RSS Feed
- Permalink
- Notify Moderator
Hi Loi Le,
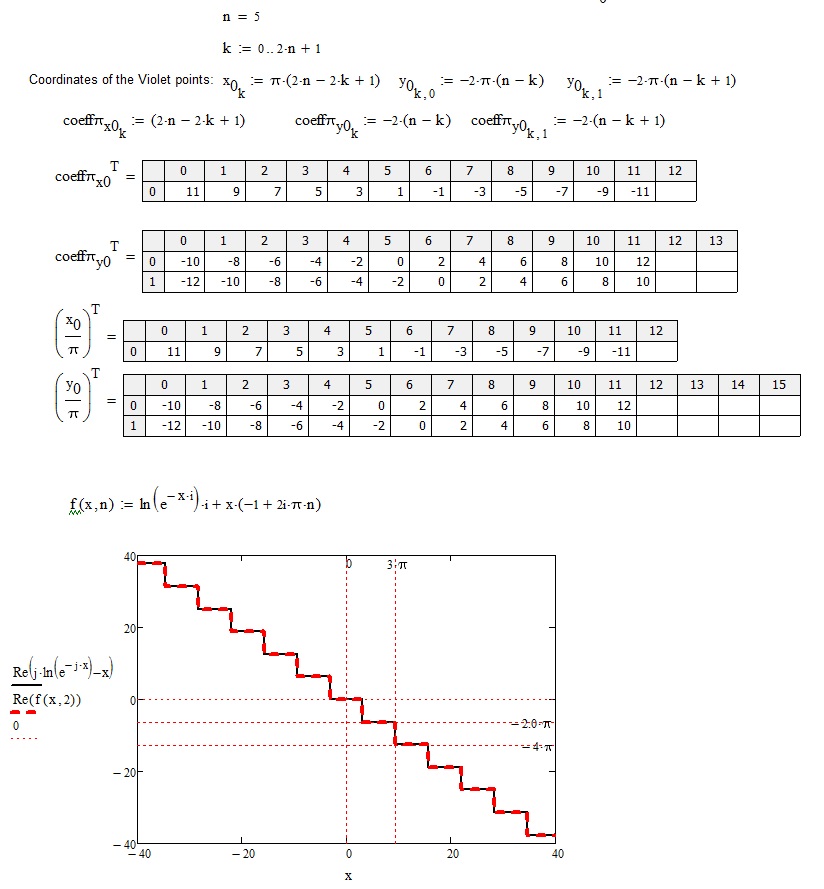
the coordinates of the violet points are:

Greetings
FM
- Mark as New
- Bookmark
- Subscribe
- Mute
- Subscribe to RSS Feed
- Permalink
- Notify Moderator
Loi Le wrote:
Need help plotting the intersection points.
Obviously thats not true! Looking at your plot we see that you found those points yourself and you just want to tease us! Why???
As so many times in the past once again you ignored that fact, that those expressions are not unique and that Mathcad can not correctly deal with it.
So the true graphs of the relations (they are not functions) are
and
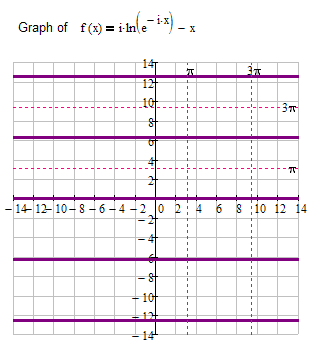
Asking for "points of intersection" or "discontinuity points" therefore is rather senseless.
Its Mathcad choosing "arbitrary" (of course there is a logic behind) parts of those plots to make it a unique function:
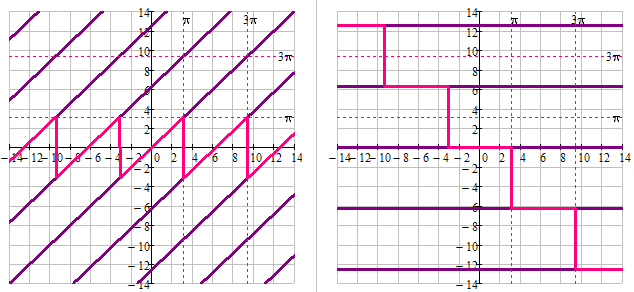
Maybe one day you will explain what your real goal is and what you would like to achieve with all your similar questions where you continuously ignore what you were already told so many times.
- Mark as New
- Bookmark
- Subscribe
- Mute
- Subscribe to RSS Feed
- Permalink
- Notify Moderator
Hi, Werner.
Many thanks for your hint. ![]()
![]()
" Obviously thats not true! "
- Because I don't undrstand the problem so I ask with my question for my self-educate. To me, "Obviously" isn't much help. Say :
" Looking at your plot we see that you found those points yourself and you just want to tease us! Why??? ". - Without going to school, so I just wish learning from the forum and nothing else. (once again, too).
" So the true graphs of the relations (they are not functions) " - Because I don't understand and I'm so sorry calling that - is function. Please help me, I really don't know that expression is called what is :
" Maybe one day you will explain what your real goal is and what you would like to achieve with all your similar questions where you continuously ignore what you were already told so many times. " - Just still not understanding and just wish learning.
Best, Best Regards.
Loi
- Mark as New
- Bookmark
- Subscribe
- Mute
- Subscribe to RSS Feed
- Permalink
- Notify Moderator
The point of my reply was that you asked how to plot those violet points and as we could see you already plotted them.
So asked for how to do something you already did.
Furthermore its often hard to guess what the real problem is you are experiencing. I think it would definitely help if you would be a little bit more detailed about what you really want to know and what the core problem is you experience or which detail you don't understand. In the example above your problem sure was not how to plot the points.
I understand that there is a language barrier but maybe with the help of google translate ...
> Because I don't understand and I'm so sorry calling that - is function.
Yes, what you see in Mathcad IS the graph of a function because Mathcad assign a unique value to each and every value of x. But the expression itself IS not unique.
Its similar to the inverse of the cosine function. The inverse is NOT a function. cos(x)=1/2 has a lot of solutions (x=+- pi/6 + k*2 pi). But in the real domain the FUNCTION arcsin is defined in a way so that its unique and this definition is internationally agreed on.
Same for the square root of a positive number n in real domain. Its defined as being only the positive solution of x^2=n. Thats true in R, but not in C.
So sometimes in mathematics we restrict results to a unique one by definition.
But usually we don't do this when we deal with complex numbers and so there is no agreed on definition for "uniqueness" with the expressions you post all the time - they are not unique and Mathcad chooses a single value by its own definition (and not even the symbolic and numeric engine agree on the same value in all cases - see example below).
> Just still not understanding and just wish learning.
Main problem now seems to be that you fully trust Mathcad and take its results at face value.
But whom would you trust more? Who is right - numeric or symbolics?

What would you say?
The answer is that both are right, but both neglect an infinite number of other possible results which are equally valid.
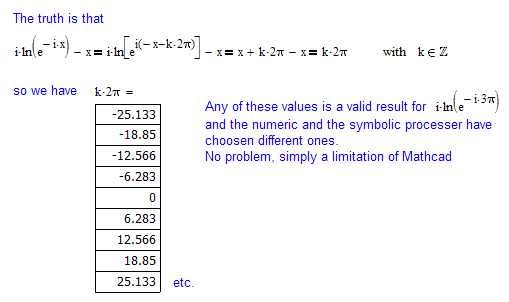
Not sure, but didn't we already talk about exactly that ambiguousness once or twice in the past?
- Mark as New
- Bookmark
- Subscribe
- Mute
- Subscribe to RSS Feed
- Permalink
- Notify Moderator
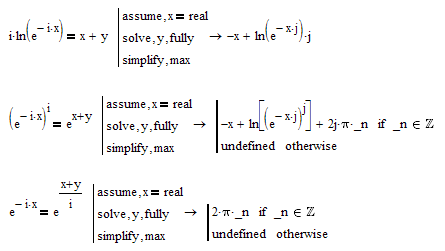
Addendum:
Mathcad/MuPad should provide the full solution in the first place but only does so after some transformations:
- Mark as New
- Bookmark
- Subscribe
- Mute
- Subscribe to RSS Feed
- Permalink
- Notify Moderator
Many, many thanks for Addendum, Werner. ![]()
![]() .
.
They're very, very helpful to me.
Regards.
Loi
- Mark as New
- Bookmark
- Subscribe
- Mute
- Subscribe to RSS Feed
- Permalink
- Notify Moderator
Werner,
I prefer to deal the problem as the following : ( within symbolic, not without symbolic if it's possible ... )
Best Regards.
Loi
- Mark as New
- Bookmark
- Subscribe
- Mute
- Subscribe to RSS Feed
- Permalink
- Notify Moderator
> I prefer to deal the problem as the following
Sorry, but I still don't see WHICH problem?
Its quite simple

but Mathcad often deals with it in its own, lets say creative, way.
Thats not a problem - its just a limitation of a program you should not trust in every respect. Thats all!
- Mark as New
- Bookmark
- Subscribe
- Mute
- Subscribe to RSS Feed
- Permalink
- Notify Moderator
Hi Loi Le,
It follows my reworking of the problem:
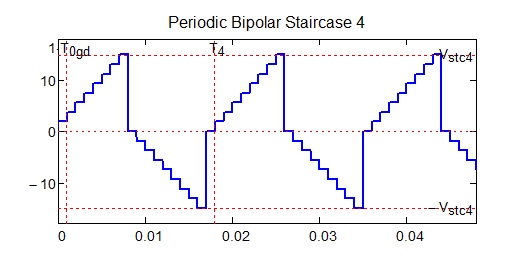
....and what would be, in your opinion, the analytical expression of the function, here below, represented?
- Mark as New
- Bookmark
- Subscribe
- Mute
- Subscribe to RSS Feed
- Permalink
- Notify Moderator
Hello FM,
I greatly appreciate your time and hint, FM. It seems that I'm starting and interested in those hints ... ![]()
![]() .
.
Best Regards.
Loi
- Mark as New
- Bookmark
- Subscribe
- Mute
- Subscribe to RSS Feed
- Permalink
- Notify Moderator
- Mark as New
- Bookmark
- Subscribe
- Mute
- Subscribe to RSS Feed
- Permalink
- Notify Moderator
With ***.xmcd, that's alway more helpful. ( I hope, from now, we would do so. )
Thanks again, FM.
Best Regards.
Loi
- Mark as New
- Bookmark
- Subscribe
- Mute
- Subscribe to RSS Feed
- Permalink
- Notify Moderator
Hi F.M.,
I review your hint and I understood your hint, as following :
Thanks again.
Best Regards.
Loi
- Mark as New
- Bookmark
- Subscribe
- Mute
- Subscribe to RSS Feed
- Permalink
- Notify Moderator
- Mark as New
- Bookmark
- Subscribe
- Mute
- Subscribe to RSS Feed
- Permalink
- Notify Moderator
Hi Loi Le,
Thank you Le Loi, but I, like others in the community, I'm an engineer, so, I took part in solving the problem just for fun, I do not see a practical use of the solution of your problem.
Best regards.
FM
- Mark as New
- Bookmark
- Subscribe
- Mute
- Subscribe to RSS Feed
- Permalink
- Notify Moderator
Thanks for your comment, F.M.,![]()
![]() I see. I am a farmer. I do math just for recreation during spare-time.
I see. I am a farmer. I do math just for recreation during spare-time.
Best Regards.
Loi
- Mark as New
- Bookmark
- Subscribe
- Mute
- Subscribe to RSS Feed
- Permalink
- Notify Moderator
Wow! good fun! Only a king can do what you do ...
- Mark as New
- Bookmark
- Subscribe
- Mute
- Subscribe to RSS Feed
- Permalink
- Notify Moderator
I'm sorry. My original question should be :
Plotting Start-Points and End-Points ?
Regards.
Loi
- Mark as New
- Bookmark
- Subscribe
- Mute
- Subscribe to RSS Feed
- Permalink
- Notify Moderator
Loi Le wrote:
I'm sorry. My original question should be :
Plotting Start-Points and End-Points ?
Regards.
Loi
The point(!) is that what you SHOULD see (but Mathcad is not showing) is not a step function but a number of horizontal lines as shown in my first answer in this thread. So there are no start- or endpoints!
Its simply Mathcad (and also other programs) which jump from one of those lines to the other at odd integer multiples of pi.
- Mark as New
- Bookmark
- Subscribe
- Mute
- Subscribe to RSS Feed
- Permalink
- Notify Moderator
I need help with : Is there a way to solve " which jump from one of those lines to the other at odd integer multiples of pi." with symbolic solve ? ( at odd integer multiples of pi ).
Best Regards.
Loi
- Mark as New
- Bookmark
- Subscribe
- Mute
- Subscribe to RSS Feed
- Permalink
- Notify Moderator
How could you solve for something which simply should not be there and is only created by the software used?
If I had a software which leaves a gap when plotting the graph of a sine like this

Does it really make sense if I ask how to solve for the points where the software stops plotting?
There is nothing mathematical to understand here! Its just a bug in a software!
In case of your expression there is a reason why Mathcad shows the steps. It has a choice among an infinite number of values to choose from and the programmers of the software had to decide which one to choose. The effect of that decision is what you see in form of that step function.
And as I had shown above, the programmers of Mathcad and the programmers of the symbolic machine muPad in Mathcad did not always agree on the method which value to chose -> here is another example:


