Community Tip - If community subscription notifications are filling up your inbox you can set up a daily digest and get all your notifications in a single email. X
- Subscribe to RSS Feed
- Mark Topic as New
- Mark Topic as Read
- Float this Topic for Current User
- Bookmark
- Subscribe
- Mute
- Printer Friendly Page
Stretching a plot
- Mark as New
- Bookmark
- Subscribe
- Mute
- Subscribe to RSS Feed
- Permalink
- Notify Moderator
Stretching a plot
Mathcad Help, under Component Structure, states that “The plot area…displays the plot of the X and Y expressions defined in the Inputs area. You can use the component block handles to resize the chart area in the x, y, or both directions.” I want to "stretch" a surface plot in the y direction only- -leaving the x and z dimensions of the plot as they are now- -but cannot access the abovementioned “handles” to do this.
Solved! Go to Solution.
Accepted Solutions
- Mark as New
- Bookmark
- Subscribe
- Mute
- Subscribe to RSS Feed
- Permalink
- Notify Moderator
Primes plotting capabilites are VERY limited and especially the 3D-plot is extremely inferior.
PTC was not able to develop a decent plot feature and so they decided in Prime 5 to add a third party chart component which they integrated into the program quite poorly.
I guess the description you cited is für this third party chart component (which is for 2D-plots only) and does not apply to the 3D-plots. So I guess the formatting which you have in mind simply can't be done with the Prime 3D-plot.
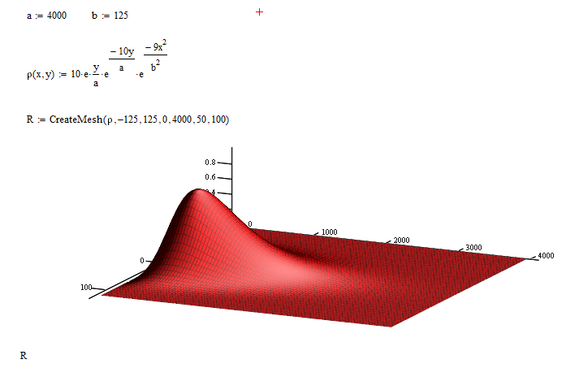
I interpreted your question so that you look for something like this (done in Mathcad 15):
- Mark as New
- Bookmark
- Subscribe
- Mute
- Subscribe to RSS Feed
- Permalink
- Notify Moderator
Click on the upper-right corner of the 3D plot area.
Then choose your axis, then change the scale.
Success!
Luc
- Mark as New
- Bookmark
- Subscribe
- Mute
- Subscribe to RSS Feed
- Permalink
- Notify Moderator
- Mark as New
- Bookmark
- Subscribe
- Mute
- Subscribe to RSS Feed
- Permalink
- Notify Moderator
Primes plotting capabilites are VERY limited and especially the 3D-plot is extremely inferior.
PTC was not able to develop a decent plot feature and so they decided in Prime 5 to add a third party chart component which they integrated into the program quite poorly.
I guess the description you cited is für this third party chart component (which is for 2D-plots only) and does not apply to the 3D-plots. So I guess the formatting which you have in mind simply can't be done with the Prime 3D-plot.
I interpreted your question so that you look for something like this (done in Mathcad 15):
- Mark as New
- Bookmark
- Subscribe
- Mute
- Subscribe to RSS Feed
- Permalink
- Notify Moderator
- Mark as New
- Bookmark
- Subscribe
- Mute
- Subscribe to RSS Feed
- Permalink
- Notify Moderator
@bobg100x wrote:
Thanks for your input. I am extremely disappointed that the software cannot provide a decent-looking surface plot.
You are not the only one who is disappointed with Prime.


