
Turn on suggestions
Auto-suggest helps you quickly narrow down your search results by suggesting possible matches as you type.
Showing results for
Please log in to access translation
Turn on suggestions
Auto-suggest helps you quickly narrow down your search results by suggesting possible matches as you type.
Showing results for
Community Tip - Learn all about the Community Ranking System, a fun gamification element of the PTC Community. X
Translate the entire conversation x
Please log in to access translation
Options
- Subscribe to RSS Feed
- Mark Topic as New
- Mark Topic as Read
- Float this Topic for Current User
- Bookmark
- Subscribe
- Mute
- Printer Friendly Page
Trendline, Curve fitting, Regression in Mathcad, Extracting values from plots or from results of functions with range variables
Mar 17, 2016
11:25 AM
- Mark as New
- Bookmark
- Subscribe
- Mute
- Subscribe to RSS Feed
- Permalink
- Notify Moderator
Please log in to access translation
Mar 17, 2016
11:25 AM
Trendline, Curve fitting, Regression in Mathcad, Extracting values from plots or from results of functions with range variables
Sorry if this question might seem trivial or a repetition but here is my question:
I will use a simple function to explain my problem - If I have a function say f(x) = x^3+20x+20. And x is a range variable e.g x=2,4,6....20. If I plot in Mathcad the function f(x) vs x, I get a polynomial curve. Now, If I say, f(x) = 22.375 is a fixed limiting value for which I want to know the value of x at this limiting value of f(x), how do I tell Mathcad to give me this value of x for which f(x)=22.375. Is there a program or Mathcad function that I can write for Mathcad to solve this for me.
I have given a very simple function to explain my problem but the function which I am dealing with is much more complex. In order to add depth to my question, you can imagine the function I am dealing with as the stress on a machine component that depends on displacements of the component. At the start of my Mathcad worksheet, I define the displacement as a range variable, e.g. x=0,1,2...9. Then through a series of many equations, I get a final equation of stress as a function of x-displacement. So the results of the stress will be an array of equal length as the defined range variable for the x-displacement. E.g. If my x-displacement was defined as x=0,1,2...9, that gives me 10 values.. So the stress result will have 10 values corresponding to the displacements 0,1,2...9. Let us say that the stress values range from 50 to 1000. However, I have a limiting stress of 550. With this limiting stress value, I can define the maximum displacement which the machine component can withstand. But this exact value (550) is not in the stress result output that Mathcad has produced. So I cannot say definitely which displacement corresponds to this limiting stress value. I can say the range in which it lies but can't say exactly its value. How can I solve this in Mathcad?
In Excel, I will plot my stress results obtained against the displacement values defined. Then I will obtain a trendline equation. Then I will use the trendline equation to get the value of x for a fixed value of f(x). The problem however is that, if the trendline equation is a polynomial, then I get multiple values of x and have to figure out based on the range I already know, which value of x is the one I want.
But, please, how can I handle this problem in Mathcad, if there is a possibility at all
Solved! Go to Solution.
ACCEPTED SOLUTION
Accepted Solutions
Mar 17, 2016
02:37 PM
- Mark as New
- Bookmark
- Subscribe
- Mute
- Subscribe to RSS Feed
- Permalink
- Notify Moderator
Please log in to access translation
Mar 17, 2016
02:37 PM
Then , if you're not happyu with providing a guess value (x:=1), but do know in between which values of x the x lies that you're looking for, you can use the alternative form of root. Here goes:

Note that (in both cases), the root is found, without providing the range of x-values. You only need that if you want to plot the function (as shown in the lower part).
Success!
Luc
9 REPLIES 9
Mar 17, 2016
01:43 PM
- Mark as New
- Bookmark
- Subscribe
- Mute
- Subscribe to RSS Feed
- Permalink
- Notify Moderator
Please log in to access translation
Mar 17, 2016
01:43 PM
The fact that you started with a defined range variable is irrelevant. Your final equation should be in the form of a function:
stress(x):=EXPRESSION_THAT_DEPENDS_ON_x
Then you need a guess value for x and a solve block:
x:=5
Given
stress(x)=550
Find(x)=
Note that "Given" is a keyword, not text, and the equals in the solve block is a Boolean equals (Ctrl =), not an assignment.
If that doesn't get you to the solution please post a worksheet.
Mar 17, 2016
02:04 PM
- Mark as New
- Bookmark
- Subscribe
- Mute
- Subscribe to RSS Feed
- Permalink
- Notify Moderator
Please log in to access translation
Mar 17, 2016
02:04 PM
See please picture of this article
Интерполяция, экстраполяция и сглаживание
I would like to translate it into English but now you can use the google translator.
Mar 18, 2016
11:23 AM
- Mark as New
- Bookmark
- Subscribe
- Mute
- Subscribe to RSS Feed
- Permalink
- Notify Moderator
Please log in to access translation
Mar 18, 2016
11:23 AM
Hi Richard,
The "Given" and "Find" solve block had some issues with my stress function because it is a function of 6 arguments. However, I wanted to investigate how the stress varies with only one argument which is the x-displacement... but the solve block kept on having issues with the other arguments which I set to zero. Anyways, the root function as stated by Luc solved my problem but I am very grateful for your quick response. As a Mathcader, I will eventually use it  ...So thanks very much.
Mar 17, 2016
02:28 PM
- Mark as New
- Bookmark
- Subscribe
- Mute
- Subscribe to RSS Feed
- Permalink
- Notify Moderator
Please log in to access translation
Mar 17, 2016
02:28 PM
To find the x-value for which a given function f(x) reaches a target value v, you can just use the root function:
First provide a guess value:
x:=1
Then find the root of f(x)-v, with:
x:= root( f(x) - v, x)
if the root can be found, then x is what you've been looking for.
With your example as an example:

But, as Richard wrote, you have to have the definition of the function f(x):=EXPRESSION_THAT_DEPENDS_ON_x.
Success!
Luc
Mar 17, 2016
02:37 PM
- Mark as New
- Bookmark
- Subscribe
- Mute
- Subscribe to RSS Feed
- Permalink
- Notify Moderator
Please log in to access translation
Mar 17, 2016
02:37 PM
Then , if you're not happyu with providing a guess value (x:=1), but do know in between which values of x the x lies that you're looking for, you can use the alternative form of root. Here goes:
Note that (in both cases), the root is found, without providing the range of x-values. You only need that if you want to plot the function (as shown in the lower part).
Success!
Luc
Mar 17, 2016
04:25 PM
- Mark as New
- Bookmark
- Subscribe
- Mute
- Subscribe to RSS Feed
- Permalink
- Notify Moderator
Please log in to access translation
Mar 17, 2016
04:25 PM
And finally, if you really (want to) understand what you're working with, you could try to find the general/symbolic solution:
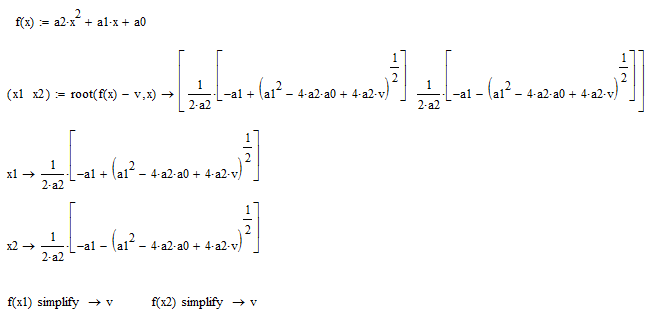
Success!
Luc
Mar 18, 2016
01:34 AM
- Mark as New
- Bookmark
- Subscribe
- Mute
- Subscribe to RSS Feed
- Permalink
- Notify Moderator
Please log in to access translation
Mar 18, 2016
01:34 AM
Or

Mar 18, 2016
11:18 AM
- Mark as New
- Bookmark
- Subscribe
- Mute
- Subscribe to RSS Feed
- Permalink
- Notify Moderator
Please log in to access translation
Mar 18, 2016
11:18 AM
Hi Valery,
Thanks very much for the answers. I have learned a whole lot from your comments in this community . I am abundantly grateful. Once more thanks
Mar 18, 2016
11:17 AM
- Mark as New
- Bookmark
- Subscribe
- Mute
- Subscribe to RSS Feed
- Permalink
- Notify Moderator
Please log in to access translation
Mar 18, 2016
11:17 AM
Dear Luc,
Thanks very much for all your proposals. The root function solved my problem like a beast I am extremely grateful for your commitment and for all the solutions you provided. Thanks very much


