Community Tip - You can subscribe to a forum, label or individual post and receive email notifications when someone posts a new topic or reply. Learn more! X
- Subscribe to RSS Feed
- Mark Topic as New
- Mark Topic as Read
- Float this Topic for Current User
- Bookmark
- Subscribe
- Mute
- Printer Friendly Page
Unable to plot
- Mark as New
- Bookmark
- Subscribe
- Mute
- Subscribe to RSS Feed
- Permalink
- Notify Moderator
Unable to plot
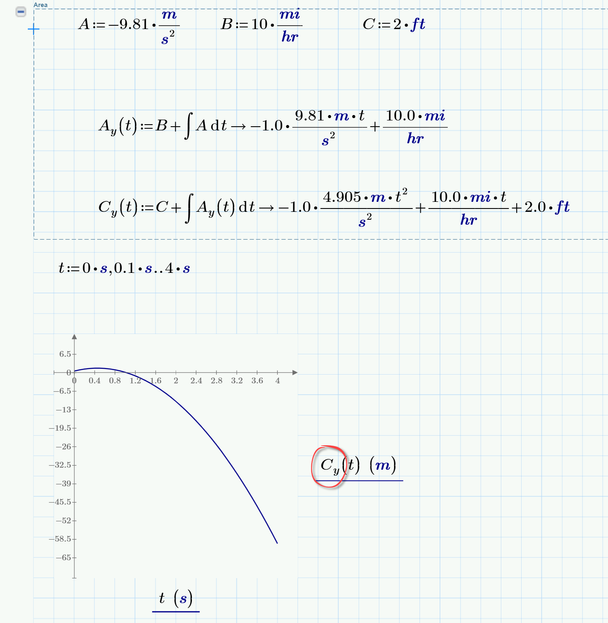
Even providing all the inputs the lot will still not plot
Solved! Go to Solution.
- Labels:
-
Mathcad Usage
Accepted Solutions
- Mark as New
- Bookmark
- Subscribe
- Mute
- Subscribe to RSS Feed
- Permalink
- Notify Moderator
Primes auto-labelling, especially in connection with units and symbolic evaluation most of the time is a PITA.
But in case of your problem, the simple solution is to turn on "Units/Constants in Symbolics" in the calculation options.
You can leave your worksheet unchanged otherwise - despite changing P.y to C.y of course:
- Mark as New
- Bookmark
- Subscribe
- Mute
- Subscribe to RSS Feed
- Permalink
- Notify Moderator
You define Ay(t) and Cy(t), and want to plot Py(t),,,?
Success!
Luc
- Mark as New
- Bookmark
- Subscribe
- Mute
- Subscribe to RSS Feed
- Permalink
- Notify Moderator
My bad it is Cy(t) against t. I also tried to add the units but still getting the error
- Mark as New
- Bookmark
- Subscribe
- Mute
- Subscribe to RSS Feed
- Permalink
- Notify Moderator
OK. You're using symbolic evaluation in your definitions of Ay and Cy. Prime is capable of such things, but (too) often creates a mess.
See how some of your units remain units (bold blue italic) and some don't.
The better way to work with symbolics is to stay symbolic until you need to input values. Something like this:
Success!
Luc
- Mark as New
- Bookmark
- Subscribe
- Mute
- Subscribe to RSS Feed
- Permalink
- Notify Moderator
Primes auto-labelling, especially in connection with units and symbolic evaluation most of the time is a PITA.
But in case of your problem, the simple solution is to turn on "Units/Constants in Symbolics" in the calculation options.
You can leave your worksheet unchanged otherwise - despite changing P.y to C.y of course:


