Community Tip - Visit the PTCooler (the community lounge) to get to know your fellow community members and check out some of Dale's Friday Humor posts! X
- Subscribe to RSS Feed
- Mark Topic as New
- Mark Topic as Read
- Float this Topic for Current User
- Bookmark
- Subscribe
- Mute
- Printer Friendly Page
Undocumented function Polygon
- Mark as New
- Bookmark
- Subscribe
- Mute
- Subscribe to RSS Feed
- Permalink
- Notify Moderator
Undocumented function Polygon
Stumbled across this function in Mathcad 11, don't know if it exists in other versions:

Symbolically it does:

Does anybody have any idea what the matrix should contain?
Especially intriguing is the fact that it should be a matrix of either 3, 6 or 7 rows.
Luc
- Labels:
-
Other
- Mark as New
- Bookmark
- Subscribe
- Mute
- Subscribe to RSS Feed
- Permalink
- Notify Moderator
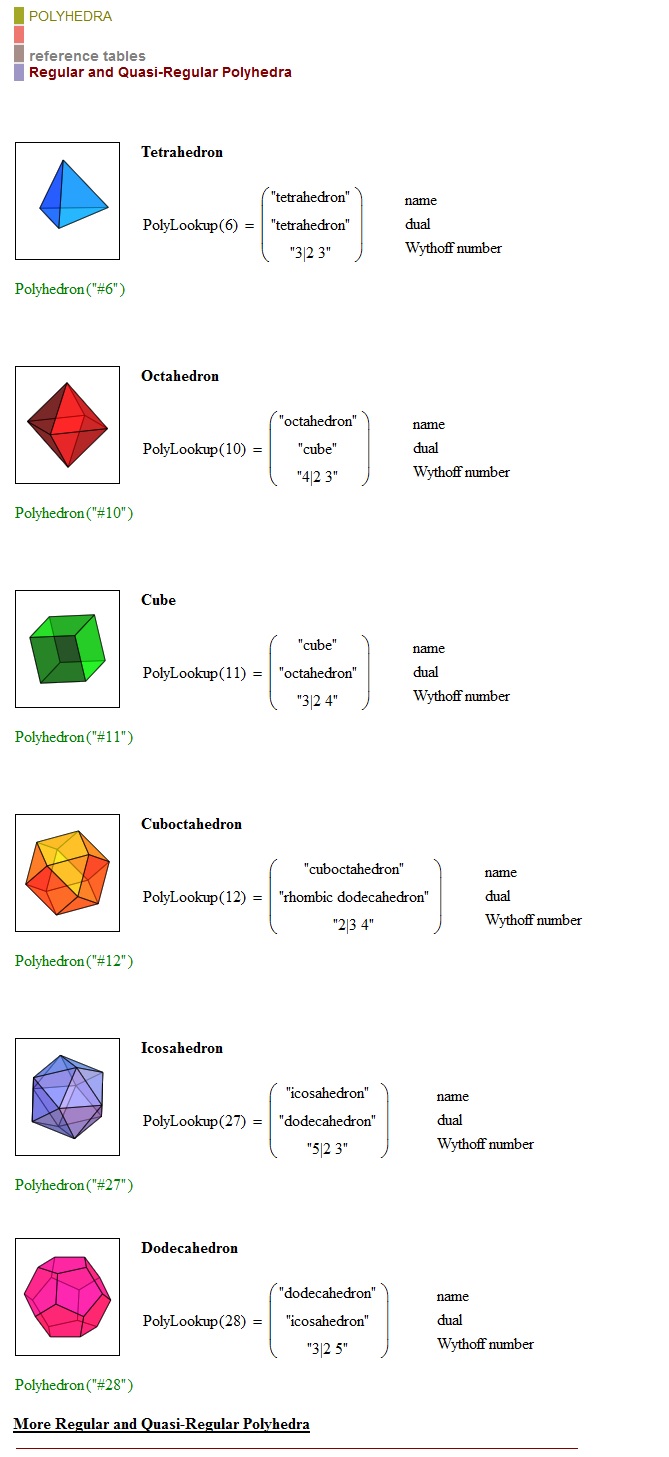
In mathcad 15 does not exist. There is, however, Polyhedron but it is another thing ...
as you can see from the following image:

- Mark as New
- Bookmark
- Subscribe
- Mute
- Subscribe to RSS Feed
- Permalink
- Notify Moderator
Luc,
Can you attach MC11 worksheet? And more: plottools - Maple Programming Help
- Mark as New
- Bookmark
- Subscribe
- Mute
- Subscribe to RSS Feed
- Permalink
- Notify Moderator
Sure,
here she is.
I had a look at the Maple plottools, but the infomation there doesn't seem to fit, so far.
Luc
- Mark as New
- Bookmark
- Subscribe
- Mute
- Subscribe to RSS Feed
- Permalink
- Notify Moderator
LucMeekes wrote:
...
I had a look at the Maple plottools, but the infomation there doesn't seem to fit, so far.
Luc
Yes, in this case, for some reason, there is a restriction on the size of the matrix.
- Mark as New
- Bookmark
- Subscribe
- Mute
- Subscribe to RSS Feed
- Permalink
- Notify Moderator
Found how to use it. It works only in plotting. Here's an example:

- Mark as New
- Bookmark
- Subscribe
- Mute
- Subscribe to RSS Feed
- Permalink
- Notify Moderator
With a bit of further experimenting I found that the first three rows of the matrix that goes into the Polygon function contain the X, Y and Z-coordinates of the polygon points respectively. Further rows determine colour or the polygon.
Here are three examples:

And their results are:

The black (tilted w.r.t. the X/Y plane) triangle is associated with L3, the red/blue/green triangle is L6 (the subsequent rows of the matrix determine the values of red, blue and green on the respective points on a scale from 0 to 1 (any value above 1 or below 0 is discarded). The third triangle uses a 4-valued colour that I haven't figured out yet; I've set the display to fill the polygon with smooth shading.
There also exists a Polyline function, that just draws a line from point to point, but the order of coordinates is unusual: Y,Z and then X. And it doesn't work with the four-valued colour (L7). The other two shapes from the same matrices above become:

Luc
- Mark as New
- Bookmark
- Subscribe
- Mute
- Subscribe to RSS Feed
- Permalink
- Notify Moderator
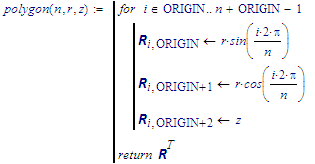
With a function polygon()

and PolyLine() that uses Polyline after rearranging the X,Y and Z-coordinates

I can now draw pentagons:

The polyline (incomplete) pentagon sits on level z=0, the full pentagon sits on level z=1.
Luc
- Mark as New
- Bookmark
- Subscribe
- Mute
- Subscribe to RSS Feed
- Permalink
- Notify Moderator
Not in 15. Not in Prime.
There was a switch from Maple to SciTech half way through the 13 releases. Perhaps it is coming from Maple.
- Mark as New
- Bookmark
- Subscribe
- Mute
- Subscribe to RSS Feed
- Permalink
- Notify Moderator
And now there appears to also exist a function Points() in Mathcad 11. It appears to be related to plotting as well.
Luc
- Mark as New
- Bookmark
- Subscribe
- Mute
- Subscribe to RSS Feed
- Permalink
- Notify Moderator
And how does it look in MC11?
- Mark as New
- Bookmark
- Subscribe
- Mute
- Subscribe to RSS Feed
- Permalink
- Notify Moderator
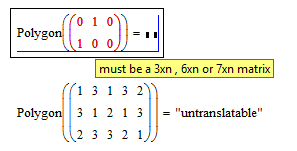
So far, I've tried only this:
All (3) errors are the same. Apparently the function requires vector(s) with (at least?) 3 elements.
The "untranslatable" is an indication that the function just wants to plot, it doesn't want to output numerical information; much like Polygon and Polyline.
Luc
- Mark as New
- Bookmark
- Subscribe
- Mute
- Subscribe to RSS Feed
- Permalink
- Notify Moderator
Yes, you forgot about the plot.
- Mark as New
- Bookmark
- Subscribe
- Mute
- Subscribe to RSS Feed
- Permalink
- Notify Moderator
Ok. A little further experimentation reveals:
The argument to the points function is a matrix, where each column defines a point by, from top to bottom: x,z,y,R,B,G coordinates and colour value. The default colour is black, so the matrix can have 3 or 6 rows.
Here's a usage example:
Luc


