
Turn on suggestions
Auto-suggest helps you quickly narrow down your search results by suggesting possible matches as you type.
Showing results for
Please log in to access translation
Turn on suggestions
Auto-suggest helps you quickly narrow down your search results by suggesting possible matches as you type.
Showing results for
Community Tip - Learn all about PTC Community Badges. Engage with PTC and see how many you can earn! X
Translate the entire conversation x
Please log in to access translation
Options
- Subscribe to RSS Feed
- Mark Topic as New
- Mark Topic as Read
- Float this Topic for Current User
- Bookmark
- Subscribe
- Mute
- Printer Friendly Page
Using a Range Variable to Plot Multiple Lines
Jan 16, 2016
10:11 AM
- Mark as New
- Bookmark
- Subscribe
- Mute
- Subscribe to RSS Feed
- Permalink
- Notify Moderator
Please log in to access translation
Jan 16, 2016
10:11 AM
Using a Range Variable to Plot Multiple Lines
I'm plotting an equation using a range variable to sweep x. I'm also using a range variable to sweep another variable in the equation (3 values). I expect to get 3 different lines on the plot, which I do. However, there is some additional solid "fill" in the plot that I don't want. I just want the 3 lines. Ideas on how to get rid of the fill?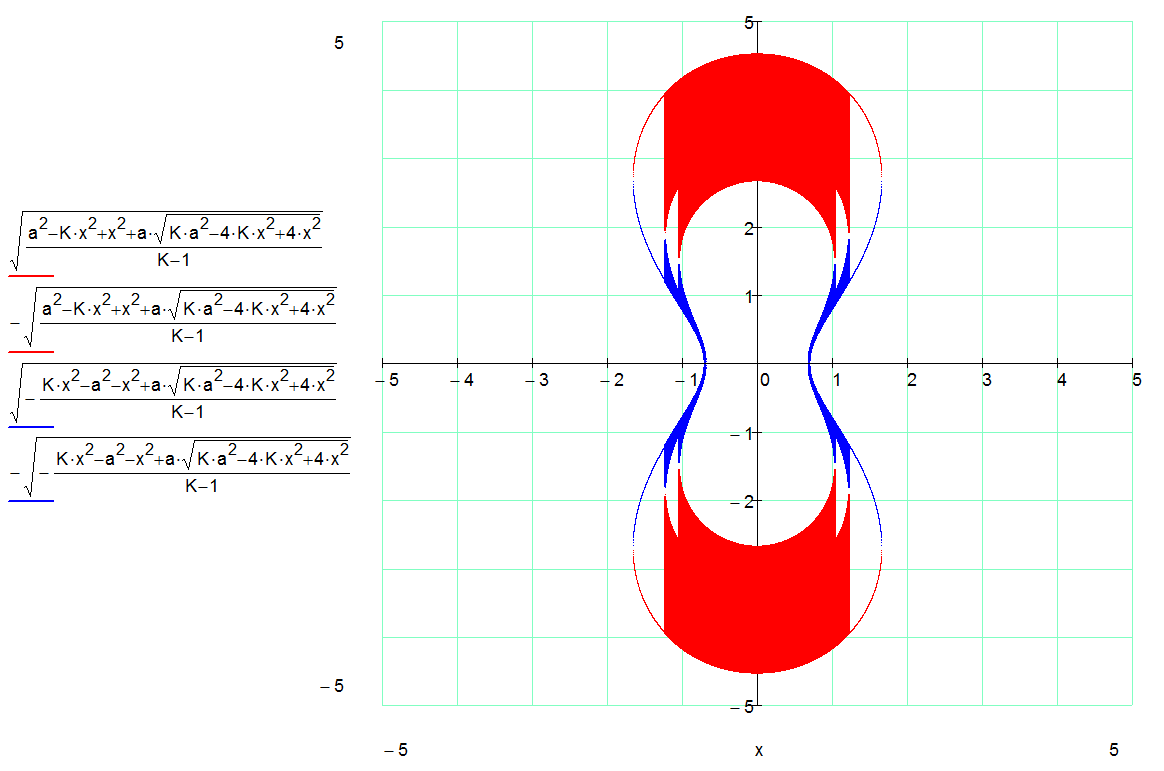
Labels:
- Labels:
-
Physics
1 REPLY 1
Jan 16, 2016
10:41 AM
- Mark as New
- Bookmark
- Subscribe
- Mute
- Subscribe to RSS Feed
- Permalink
- Notify Moderator
Please log in to access translation
Jan 16, 2016
10:41 AM
It's better to use vectors and matrices. Each column of the matrix plots as a separate line.


