Community Tip - Want the oppurtunity to discuss enhancements to PTC products? Join a working group! X
- Subscribe to RSS Feed
- Mark Topic as New
- Mark Topic as Read
- Float this Topic for Current User
- Bookmark
- Subscribe
- Mute
- Printer Friendly Page
Vector Differentiation Quicksheet Question
- Mark as New
- Bookmark
- Subscribe
- Mute
- Subscribe to RSS Feed
- Permalink
- Notify Moderator
Vector Differentiation Quicksheet Question
In the Differentiation and Integration of Data Vectors quicksheet, when the function fit(x) is plotted using the variable f(z) versus z, z hasn't yet been defined. When I duplicated the quicksheet in a blank worksheet, I expected my plot to fail because I hadn't defined z. Wrong. It plotted but not the same range as the quicksheet. What is z in this quicksheet and how do you control it's min, maximum and increment between data points?
Solved! Go to Solution.
- Labels:
-
Statistics_Analysis
Accepted Solutions
- Mark as New
- Bookmark
- Subscribe
- Mute
- Subscribe to RSS Feed
- Permalink
- Notify Moderator
Andy Stevenson wrote:
Thanks Luc. When you don't set up the range variable beforehand, what is the step size? So in your case, before you defined "hoho", what was the step size?
The Prime 3.1 Help says a Quick Plot has 500 points, so the step size will depend upon what the limits of the plot are. I'm not sure how many are in a M15 plot, but it is dense:

One other thing to note is that you can change the range of the x axis simply by entering new values (numbers or variables) into the minimum & maximum axis placeholders, as I've done in the above plot; the Plot component will automatically vary x over the new range and with appropriate step size for the number of points - as further shown below.

Stuart
- Mark as New
- Bookmark
- Subscribe
- Mute
- Subscribe to RSS Feed
- Permalink
- Notify Moderator
You talk about quicksheet in what version of Mathcad?
- Mark as New
- Bookmark
- Subscribe
- Mute
- Subscribe to RSS Feed
- Permalink
- Notify Moderator
15
- Mark as New
- Bookmark
- Subscribe
- Mute
- Subscribe to RSS Feed
- Permalink
- Notify Moderator
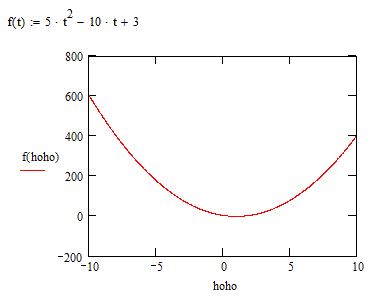
If you plot a (any) function of a (any) variable x,t or z (or any other name) that variable gets defined from -10 to 10.

To control its range and step, simply define it yourself.

There's no magic. Consider it a free gift that you can use if you forgot to define the running variable.
This example was done in MathCad 11
Success!
Luc
- Mark as New
- Bookmark
- Subscribe
- Mute
- Subscribe to RSS Feed
- Permalink
- Notify Moderator
Thanks Luc. When you don't set up the range variable beforehand, what is the step size? So in your case, before you defined "hoho", what was the step size?
- Mark as New
- Bookmark
- Subscribe
- Mute
- Subscribe to RSS Feed
- Permalink
- Notify Moderator
Andy Stevenson wrote:
Thanks Luc. When you don't set up the range variable beforehand, what is the step size? So in your case, before you defined "hoho", what was the step size?
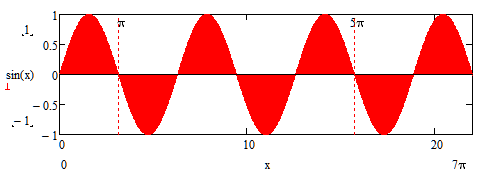
The Prime 3.1 Help says a Quick Plot has 500 points, so the step size will depend upon what the limits of the plot are. I'm not sure how many are in a M15 plot, but it is dense:

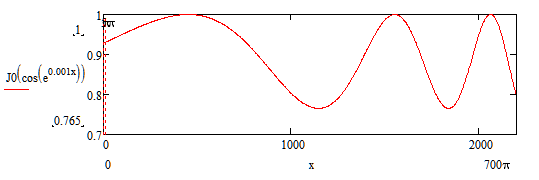
One other thing to note is that you can change the range of the x axis simply by entering new values (numbers or variables) into the minimum & maximum axis placeholders, as I've done in the above plot; the Plot component will automatically vary x over the new range and with appropriate step size for the number of points - as further shown below.

Stuart


