Community Tip - New to the community? Learn how to post a question and get help from PTC and industry experts! X
- Subscribe to RSS Feed
- Mark Topic as New
- Mark Topic as Read
- Float this Topic for Current User
- Bookmark
- Subscribe
- Mute
- Printer Friendly Page
extracting data from a matrix/table with specific index
- Mark as New
- Bookmark
- Subscribe
- Mute
- Subscribe to RSS Feed
- Permalink
- Notify Moderator
extracting data from a matrix/table with specific index
This sheet represent calculation of hydrogen flow from through the porous membrane as a
function of time. The flow is experimentaly measured ("measuredFlow") and calculated from current (CurrentData), in order to compare yield. Notes reperesent temperature at certain time.
I want to correlate flow at the certain temperature, at a certain time.
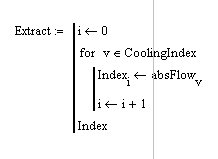
This is performed by "CoolingIndex". The data in CoolingIndex table are acctually indexes
of the "absFlow", which is the flow at the certain time, at a certain temperature. And I want to extract only absFlow data with the index k.
The values in the CoolingIndex table are as they should be, when i perform this in Excell (manually). But somehow, the values of k are not the same as values in the CoolingIndex table. Where I am making a mistake? How can I obtain k, the same as the values in the CoolingIndex table.
Thanks!
- Labels:
-
Statistics_Analysis
- Tags:
- physical_chemistry
- Mark as New
- Bookmark
- Subscribe
- Mute
- Subscribe to RSS Feed
- Permalink
- Notify Moderator
I'm a little confused. Is the absFlow[k values correct?
Mike
- Mark as New
- Bookmark
- Subscribe
- Mute
- Subscribe to RSS Feed
- Permalink
- Notify Moderator
Success, I think.
Have a look at the attached.
Mike
- Mark as New
- Bookmark
- Subscribe
- Mute
- Subscribe to RSS Feed
- Permalink
- Notify Moderator
The problem is solved. Thank you very much! If it is not a problem, can u explain me the meaning of the math used in inserted image and how actually works because I want to know for the future....

- Mark as New
- Bookmark
- Subscribe
- Mute
- Subscribe to RSS Feed
- Permalink
- Notify Moderator
Explanation in worksheet.
Hopefully it helps.
Mike


