Community Tip - Did you get called away in the middle of writing a post? Don't worry you can find your unfinished post later in the Drafts section of your profile page. X
- Subscribe to RSS Feed
- Mark Topic as New
- Mark Topic as Read
- Float this Topic for Current User
- Bookmark
- Subscribe
- Mute
- Printer Friendly Page
plotting topography data
- Mark as New
- Bookmark
- Subscribe
- Mute
- Subscribe to RSS Feed
- Permalink
- Notify Moderator
plotting topography data
Hello Everyone,
The data for cornea topography is loaded in the worksheet attached. The contour plot is generated using the 2-D interpolation algorithm. However, when compared to the topography system's original performance, the plot has a very low resolution. How can I get a plot that looks like the system output?
I was also curious about how the data could be transferred and plotted in polar coordinates because I was having trouble mapping f(x,y) to f(r, theta) coordinates.
Any advice will be greatly appreciated.
All the best,
Payman.
Solved! Go to Solution.
- Labels:
-
Algebra_Geometry
-
Programming
Accepted Solutions
- Mark as New
- Bookmark
- Subscribe
- Mute
- Subscribe to RSS Feed
- Permalink
- Notify Moderator
Addendum
I used a routine I wrote a while ago to accomplish the interpolation and got a result similar to yours (not sure why it looks so ugly at the circular border). My routine is much slower than the built-in one but has the advantage of not being limited to square data matrices. Its not necessary to use it in your case and I just gave it a try to compare to your approach.
BTW, here is a way to add a rudimentary color legend:
MC15 sheet attached
- Mark as New
- Bookmark
- Subscribe
- Mute
- Subscribe to RSS Feed
- Permalink
- Notify Moderator
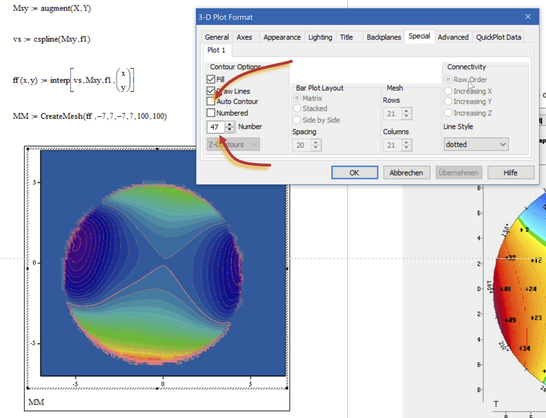
You may try to uncheck "Auto Contour" and set a higher number of contourlines manually.
I also draw the contour lines in a single solid color, not Colormap.
To duplicate the colors in the picture you provided, I guess you will have to create a custom color map.
BTW, the data you embedded in the MC sheet seems not to be the very same which was used in the picture you provided.
The data seems to be cartesian anyway, so what kind of polar plot (cylinder coordinates?) do you have in mind?
- Mark as New
- Bookmark
- Subscribe
- Mute
- Subscribe to RSS Feed
- Permalink
- Notify Moderator
Thank you so much, Werner_E.
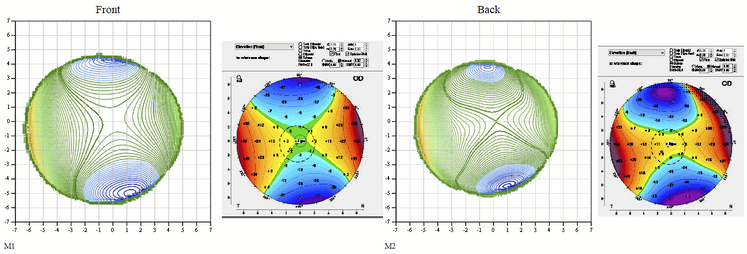
I have now loaded the whole data in the worksheet containing the front and back surface data. The interpolation argument has been changed to (y,x) instead of (x,y) and I think the orientation is now right. The issue is that the unit plot is within an 8-mm circle, while the worksheet plot is within a 6-mm radius circle. Is there any detail that has been lost?
I should point out that I intend to use the topography data for optical raytracing through the eye (i.e., finding the normal vector and ray intersection), so graph quality isn't a priority.
Thank you once again for your assistance.
Payman.
- Mark as New
- Bookmark
- Subscribe
- Mute
- Subscribe to RSS Feed
- Permalink
- Notify Moderator
The issue is that the unit plot is within an 8-mm circle, while the worksheet plot is within a 6-mm radius circle. Is there any detail that has been lost?
I am not sure if I understand the issue. As written above it looks to me that the plots in the pictures you try to duplicate are based on different data values than the ones in your Mathcad sheet.
After all the row and column headers in the data in your sheet are running from -7 to 7 only (with mostly zero values at the ends) while the pictures show values up to about 8.5 (I see no negative values in the pics?)
Furthermore the plots in the Mathcad sheet are not symmetric on contrary to the plots seen in the pictures. You may turn on gridlines to better see that:
I am not sure about the effect interpolation may have. Spline interpolation sometimes can have undesired side effects. You may try lspline or pspline instead of cspline (affects basically the treatment of the end values only) or even linear interpolation.
But primarily I would check the data if its really the data which should yield the plots seen in the pictures.
- Mark as New
- Bookmark
- Subscribe
- Mute
- Subscribe to RSS Feed
- Permalink
- Notify Moderator
In my correspondence with the company, they informed me that the graph representation has two scale modes: radius and diameter scales, both of which use the same data. The radius mode displays scales ranging from -4mm to 4mm (seen in the attached worksheet), resembling our plot. The scale for the diameter mode is 0 to 8 mm.
So the scale issue is now addressed, but my plot appears to be a mirror image of the original map. This makes me wonder if front_function(x,y) accurately depicts the data.
Payman.
- Mark as New
- Bookmark
- Subscribe
- Mute
- Subscribe to RSS Feed
- Permalink
- Notify Moderator
Could it be that in the Oculus-Plot x and y axis are exchanged?
The pic sure does not show the same data as provided in your Matrix f.
In the oculus pix the values seem to range from -75 to +75 while the values in f range from -79.9 to 230.4.
So with different data, why should the plots look the same?
- Mark as New
- Bookmark
- Subscribe
- Mute
- Subscribe to RSS Feed
- Permalink
- Notify Moderator
Addendum
I used a routine I wrote a while ago to accomplish the interpolation and got a result similar to yours (not sure why it looks so ugly at the circular border). My routine is much slower than the built-in one but has the advantage of not being limited to square data matrices. Its not necessary to use it in your case and I just gave it a try to compare to your approach.
BTW, here is a way to add a rudimentary color legend:
MC15 sheet attached
- Mark as New
- Bookmark
- Subscribe
- Mute
- Subscribe to RSS Feed
- Permalink
- Notify Moderator
To further identify the map orientation that has now been fixed, I selected an unsymmetric topographical instance. The way I cut the matrix from bottom to top was incorrect, and I should have used the inverse() or vertflip() functions instead.
Thank you very much for your insightful comments.
All the best,
Payman.


