Community Tip - You can subscribe to a forum, label or individual post and receive email notifications when someone posts a new topic or reply. Learn more! X
- Subscribe to RSS Feed
- Mark Topic as New
- Mark Topic as Read
- Float this Topic for Current User
- Bookmark
- Subscribe
- Mute
- Printer Friendly Page
prime 3 bug in 3d plot?
- Mark as New
- Bookmark
- Subscribe
- Mute
- Subscribe to RSS Feed
- Permalink
- Notify Moderator
prime 3 bug in 3d plot?
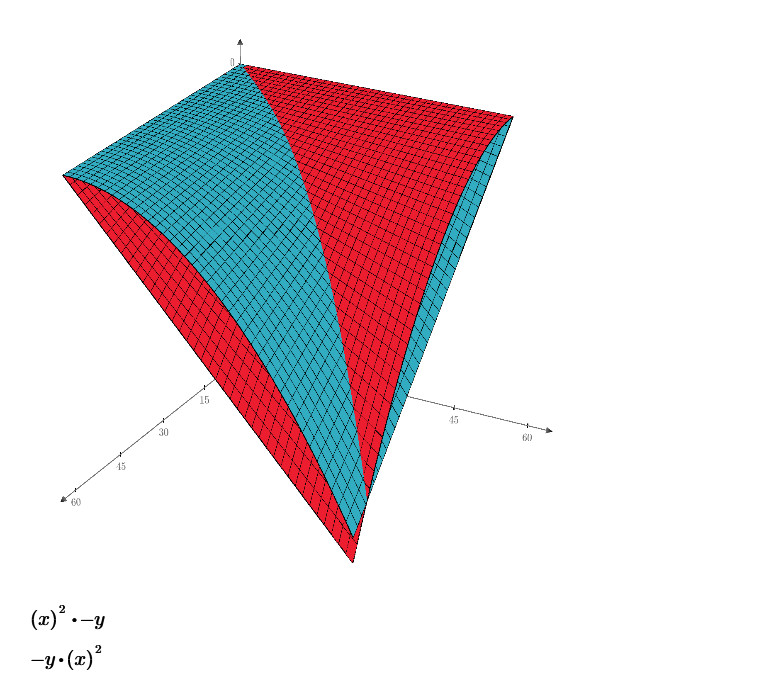
I was experimenting with prime 3 and the "new" plot capabilities when I came across this strange phenomenon.

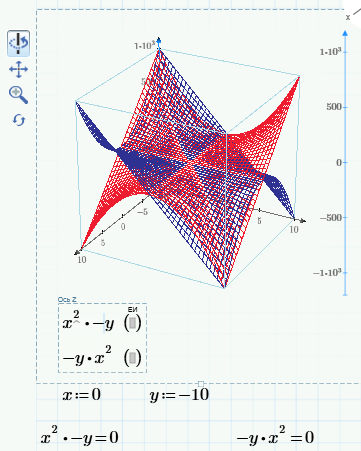
For some reason the two plots are plotted against different axis.
Is this a bug or is it supposed to happen?
- Labels:
-
Other
- Mark as New
- Bookmark
- Subscribe
- Mute
- Subscribe to RSS Feed
- Permalink
- Notify Moderator
Yes, one error but a fine error - we create one vintage chair:

- Mark as New
- Bookmark
- Subscribe
- Mute
- Subscribe to RSS Feed
- Permalink
- Notify Moderator
Thats not a bug. You can also plot the function b*a^2 and how should Prime know which one is "x" and which one is "y"? So the best it can do is to consider that the first variable it meets, reading the expression from left to right, has to be "x" and the other "y", no matter what the user has named them.
In other words, plotting "-y*x^2" gives the same plot as "-a*b^2" or "-B*A^2" or "-x*y^2".
So in your second plot y gets "x" and x gets "y" and you get a mirrored surface.
Of course it would be more professional if we had the choice to define and (re)name the axis independendly for each plot.
You are on the safe side if you define the functions beforehand f(x,y):=x^2*(-y) and g(x,y):=-y*x^2 and plot those functions. This time you get the same plot twice as you expected. To get the plot you showed you would have to define g(y,x):-y*x^2 (note the different order in the parameter parentheses.
Sidenote: I still consider it a bug that Prime (as well as Mathcad) allows expressions with two consecutive operators without any operand inbetween or w/o grouping parentheses, like in your first expression where the multiplication dot is followed by the minus sign. IMHO thats simply wrong. Prime should either not allow the input of that kind of expressions or add the necessary parentheses automatically.


