Community Tip - You can subscribe to a forum, label or individual post and receive email notifications when someone posts a new topic or reply. Learn more! X
- Subscribe to RSS Feed
- Mark Topic as New
- Mark Topic as Read
- Float this Topic for Current User
- Bookmark
- Subscribe
- Mute
- Printer Friendly Page
simple, 2 variable function, range for variables, plot
- Mark as New
- Bookmark
- Subscribe
- Mute
- Subscribe to RSS Feed
- Permalink
- Notify Moderator
simple, 2 variable function, range for variables, plot
I'm brand new to Mathcad and racking my brain over something which should be simple. All I want to do is write and plot the following:
M : 6*P + 1440*G
P: 1000, 2000; 10000
G: 140, 141; 150
My thought is that the solution indexes through each increment and 2D matrix develops and I plot with P (x axis), G (y axis), and M (z axis). But nothing is working for me.
Can you help?
Many thanks,
dscott
- Labels:
-
Other
- Mark as New
- Bookmark
- Subscribe
- Mute
- Subscribe to RSS Feed
- Permalink
- Notify Moderator
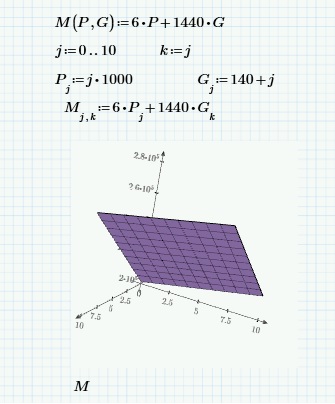
Perhaps so?

- Mark as New
- Bookmark
- Subscribe
- Mute
- Subscribe to RSS Feed
- Permalink
- Notify Moderator
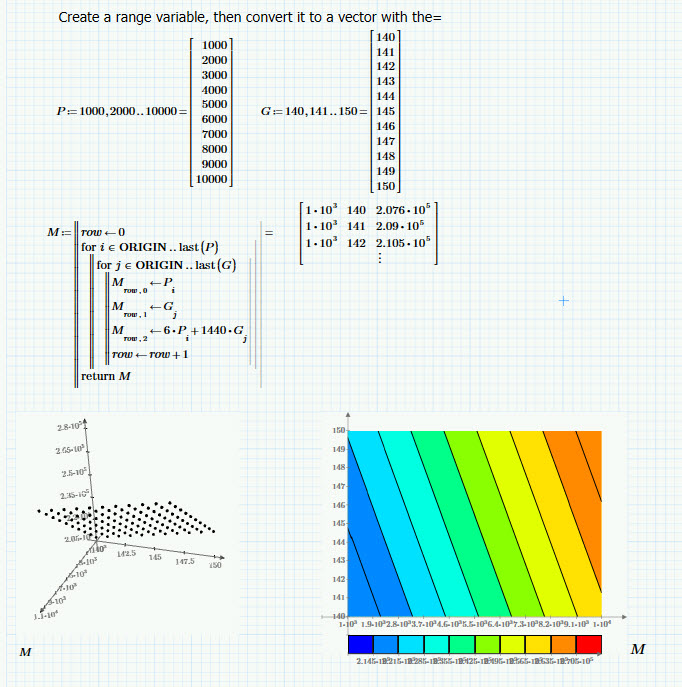
You just need a simple program. I think the help section should walk you through programming.

- Mark as New
- Bookmark
- Subscribe
- Mute
- Subscribe to RSS Feed
- Permalink
- Notify Moderator
Not sure if you want just to see the points or the whole plane, so her are both and P- and G- axis are correctly scaled

- Mark as New
- Bookmark
- Subscribe
- Mute
- Subscribe to RSS Feed
- Permalink
- Notify Moderator
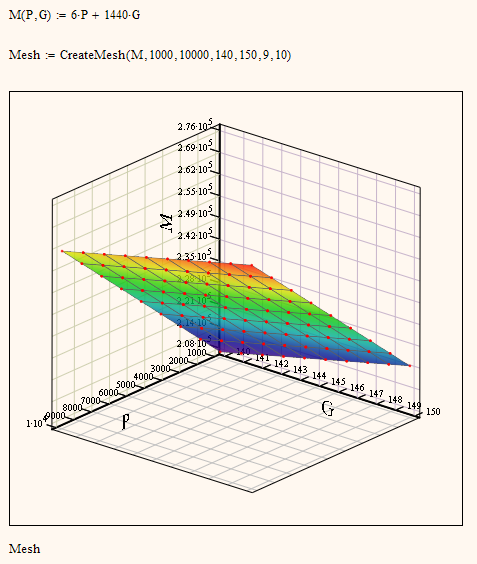
Werner had the right answer--read up on CreateMesh!
- Mark as New
- Bookmark
- Subscribe
- Mute
- Subscribe to RSS Feed
- Permalink
- Notify Moderator
We could plot the function M directly, so CreateMesh would not be mandatory.
But its far more convenient to use CreateMesh as opposed to fumble around changing the values in the QuickPlot Data settings of the 3D-Plot format menu.
Hope you are using Mathcad 15 (or below) and not Prime as Prime's plotting capabilities are mediocre and especially Primes 3D-plots are not worth using.
PTC promised enhancements concerning plotting for Prime 4, but as far as I know now they are promising it for Version 5.
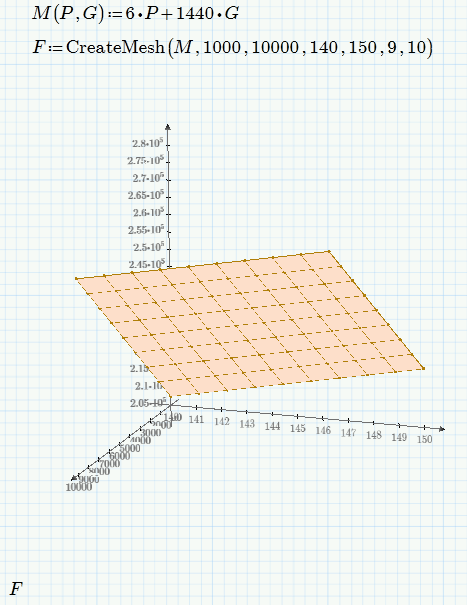
But don't get me wrong - the method using CreateMesh will work in Prime, too, and the result you get will look similar to what F.M. had shown (but with correctly scaled axis). Formatting options are very limited, though.
EDIT: Here is a Prime version. No colormap, no transparency, no way to format the points and lines in different colors and thicknesses, no grid in the coordinate planes, no axis names, ...

- Mark as New
- Bookmark
- Subscribe
- Mute
- Subscribe to RSS Feed
- Permalink
- Notify Moderator
Group,
You are awesome! I expected to get back here today and not find any updates. A thousand thanks to you and especially you WE for going in such depth. I definitely think CreateMesh is a good way to go.
Very grateful,
David
PS - I like the other examples too. They provide good ideas for future reference.


