1-Visitor
November 11, 2015
Solved

How I can shade area under graph in Mathcad Prime 3.1?

  • November 11, 2015
  • 2 replies
  • 13585 views

Hello, how I can shade area under graph in Mathcad Prime 3.1?

Area.png

Best answer by Werner_E

Richard Jackson wrote:

If the chart I think from a point table as it could color the area?

It could, but it would be a lot more work than what Stuart shows.

Thats true 😉

2 replies

19-Tanzanite
November 11, 2015

I didn't write this, I just fished it out of my collection and converted it to Prime

23-Emerald V
November 12, 2015

Richard Jackson wrote:

I didn't write this, I just fished it out of my collection and converted it to Prime

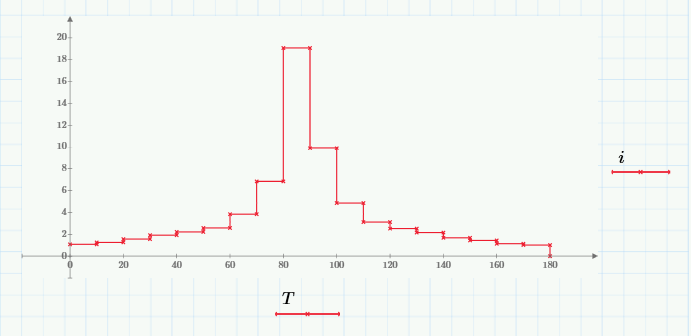
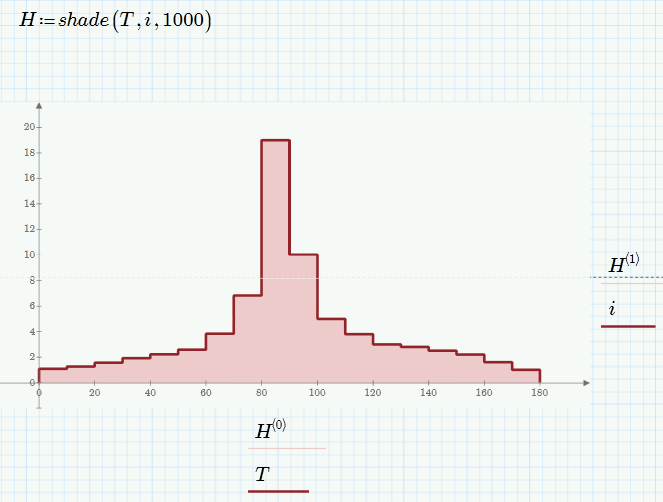
Neat.  For simple plots, you can also get by using the Column trace type (I've also selected the "Cross Axes at 0,0" to get rid of the space between the plot proper and the x axis).  I've doubled up on the target function to highlight the edge.

Stuart

rhanet1-VisitorAuthor
1-Visitor
November 12, 2015

If the chart I think from a point table as it could color the area?

Tabla.png

23-Emerald V
November 12, 2015

Ricardo Huaranga wrote:

If the chart I think from a point table as it could color the area?

Do you mean something like this?

If so, just click on the y-axis variable you want (i in this case) and select "Column Trace" from the "Change Type" drop down.

Stuart

rhanet1-VisitorAuthor
1-Visitor
November 12, 2015

Hi Stuart, thank you very much for your help.

I want to make is this:

plot.png

The red graph from data T i vs created. I want to color the green area.