
Issue with the plotting of two vectors
- Mark as New
- Bookmark
- Subscribe
- Mute
- Subscribe to RSS Feed
- Permalink
- Notify Moderator
Issue with the plotting of two vectors
Hi,
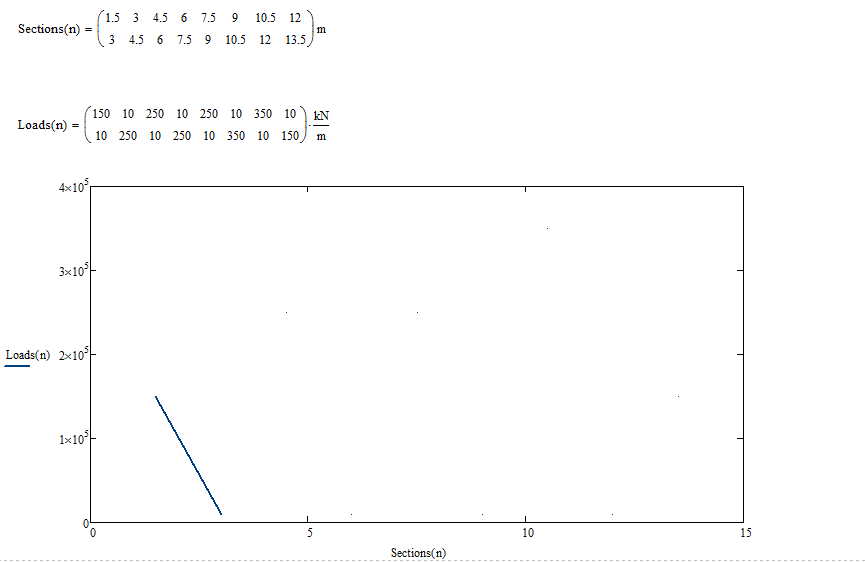
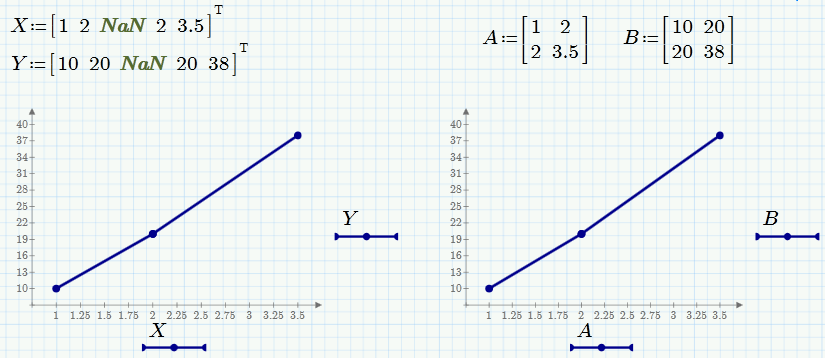
I am trying to plot a graph using the following vectors, but I am getting a graph which is different from the expected:
What I am getting is below:
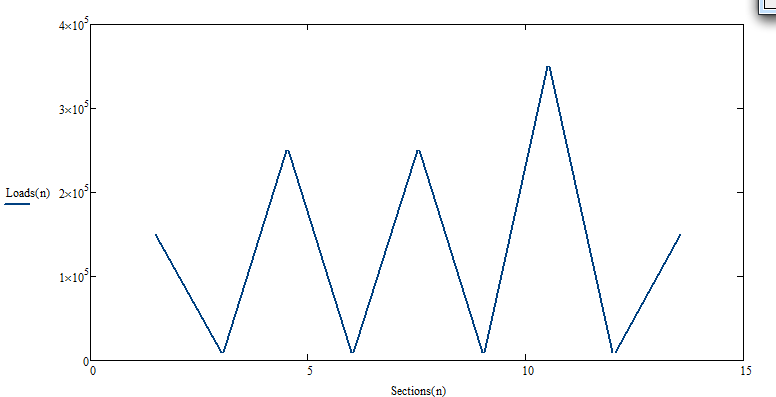
Where as the one I am expecting is as below:
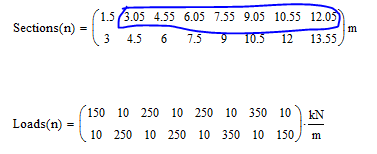
Though, I could able to get this in Mathcad by manipulating the values in the vectors as below, it is still a manipulation of the data!!! . Can someone suggest me where am I doing the mistake?
- Labels:
-
Statistics_Analysis
- Mark as New
- Bookmark
- Subscribe
- Mute
- Subscribe to RSS Feed
- Permalink
- Notify Moderator
I don't know how Mathcad interprets your data format and why it draws all points but only one line and also I don't know why its drawing the lines you expect when you slightly change the data. Maybe Mathcad gets confused because even in a waterfall plot, where on the ordinate you usually have a matrix with more than one column, on the abscissa there still is expected a one column vector.
To plot a polygon you usually would provide a 9x1 vector with x-coordinates for the abscissa and a 9x1 vector with y-coordinates for the ordinate. If you want to suspend connecting the points you would insert a NaN in those vectors.
As a quick hack you can plot the transposed of your matrices. But this will only work if each value in the first row is the very same as the value one column earlier in the second row.
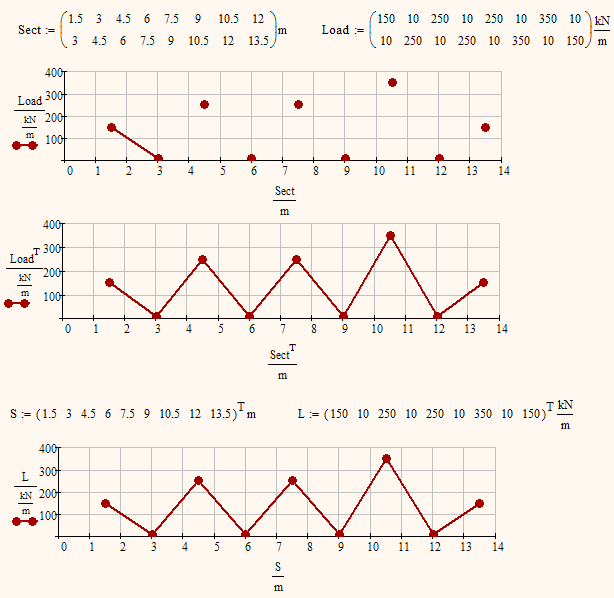
ADDENDUM: I just noticed that probably you ran into a bug in Mathcad!
If we plot a series of not connected line segments (separated by NaN's) Mathcad refuses to plot a segment if the start point of it equals the endpoint of the last segment!!
So if it can happen that you don't have a polygon with all points connected, I would write a small program which post-processes the output of your Sections and Load program and creates the correct data structure considering that bug (= insert a NaN only if necessary).

- Mark as New
- Bookmark
- Subscribe
- Mute
- Subscribe to RSS Feed
- Permalink
- Notify Moderator
Sidenote: While I never would suggest to use Prime for any serious work, the aforementioned bug is not present in Prime and also your way to draw the line segments works as expected:
- Mark as New
- Bookmark
- Subscribe
- Mute
- Subscribe to RSS Feed
- Permalink
- Notify Moderator
As already mentioned I am a newbie to Mathcad and not much familiar with NaN, the one which you are mentioning in your reply.
Can you please elaborate it. In my case the frequency for inserting this NaN may be very occasional, but again I can not rule this situation out. Also, the functions which I am using are not of the manual entry type, they will be generated based on some of the previously defined variables and since these are variables I cannot know in advance where to insert them (NaNs).
The working file for this is attached herewith for your reference.

