Question
Issue with the plotting of two vectors
Hi,
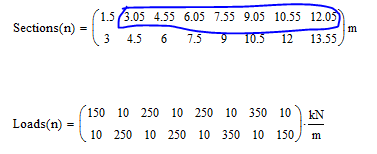
I am trying to plot a graph using the following vectors, but I am getting a graph which is different from the expected:
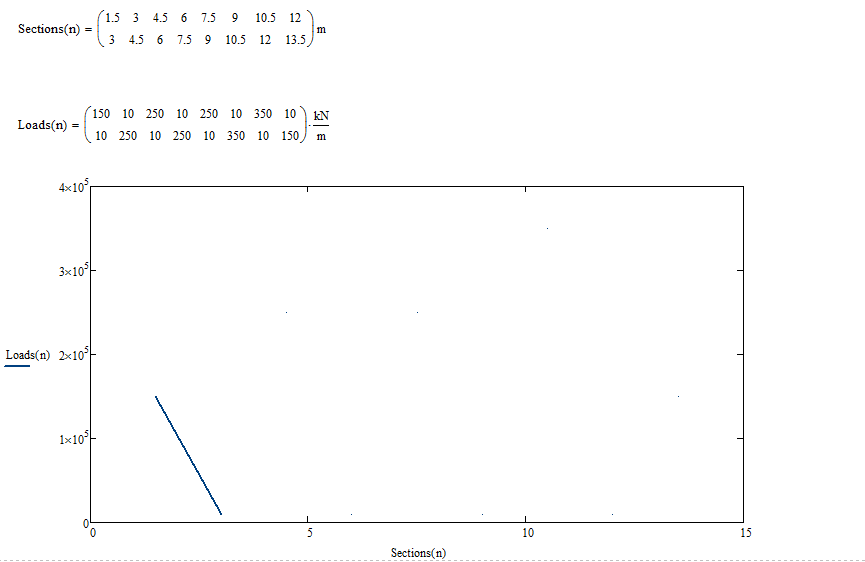
What I am getting is below:
Where as the one I am expecting is as below:
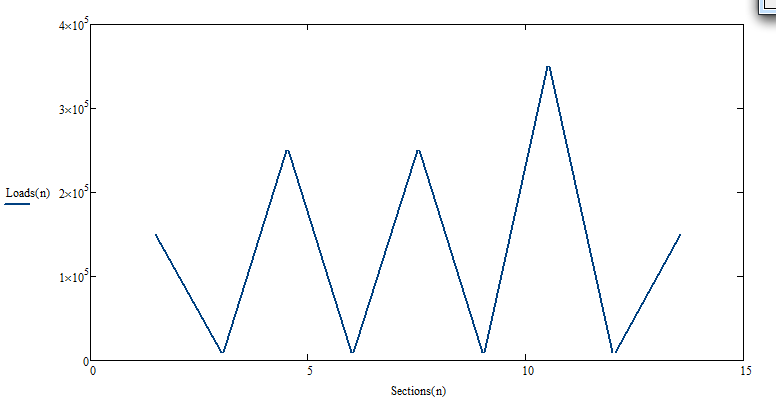
Though, I could able to get this in Mathcad by manipulating the values in the vectors as below, it is still a manipulation of the data!!! . Can someone suggest me where am I doing the mistake?