Community Tip - Your Friends List is a way to easily have access to the community members that you interact with the most! X
- Subscribe to RSS Feed
- Mark Topic as New
- Mark Topic as Read
- Float this Topic for Current User
- Bookmark
- Subscribe
- Mute
- Printer Friendly Page
Plotting circle
- Mark as New
- Bookmark
- Subscribe
- Mute
- Subscribe to RSS Feed
- Permalink
- Notify Moderator
Plotting circle
Hi everyone.
I'm trying to plot 2 lines and a circle in mathcad prime 4, in the form (x-x0)^2+(y-y0)^2=R^2.
I have values for x0 and y0 and R, but I can't figure out how to plot it. Solving for y gives me complex numbers.
x0 and y0 are defined values of some earlier calculations, so their value can change, so they are not "fixed" numbers.
Any simple way to do this? (Seems all the info on this I can find is pretty old, and I can't open example files and such...)
- Mark as New
- Bookmark
- Subscribe
- Mute
- Subscribe to RSS Feed
- Permalink
- Notify Moderator
One way is as follows:
i:=0..360
thetai = i*deg (i as a subscript on theta)
x:=x0+R*cos(theta)
y:=y0+R*sin(theta)
Then simply plot y vs x.
Alan
- Mark as New
- Bookmark
- Subscribe
- Mute
- Subscribe to RSS Feed
- Permalink
- Notify Moderator
Ok, that works. Thanks.
- Any way to make it a function of x? That would be great, that way I could check intersection points with the lines..
- Mark as New
- Bookmark
- Subscribe
- Mute
- Subscribe to RSS Feed
- Permalink
- Notify Moderator
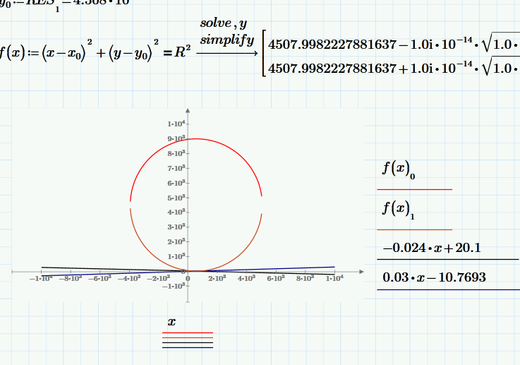
You can plot versus x, but it's a double-valued function:
- Mark as New
- Bookmark
- Subscribe
- Mute
- Subscribe to RSS Feed
- Permalink
- Notify Moderator
You may use your appraoch even though the symbolic result uses the imaginary unit (the values derived are real anyway):
To get a closed curve you may define a range variable for plotting as Fred had shown.
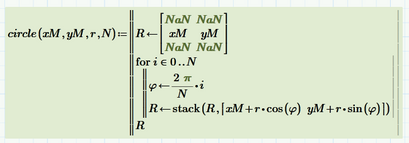
But a better approach IMHO is to use different representations for calculations and for plotting. The parameter representation Alan suggested is best suited for plotting. I prefer a small program which returns a matrix of x and y-values of the points of any circle which can be used easily to plot different circles:
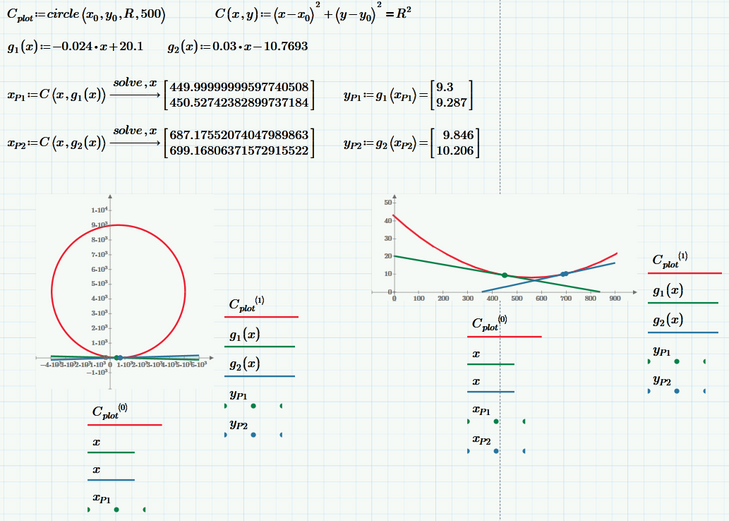
You may use this in the following way. I also plotted the two lines which as it looks are nearly tangents of the circle:
Worksheet in format P5 attached
- Mark as New
- Bookmark
- Subscribe
- Mute
- Subscribe to RSS Feed
- Permalink
- Notify Moderator
I used the program that the one person wrote and it worked fine. The challenge for me, not being the sharpest tool in the shed, was to figure out what the parameters were and then to figure out that I had to take the two columns of the resultant matrix separately to get the 2D plot to work. I use PTC MCAD 3.0 PRIME but not professionally.
- Mark as New
- Bookmark
- Subscribe
- Mute
- Subscribe to RSS Feed
- Permalink
- Notify Moderator
PDF shows how to plot the circles.
- Tags:
- Prime_7.0
- Mark as New
- Bookmark
- Subscribe
- Mute
- Subscribe to RSS Feed
- Permalink
- Notify Moderator

Using posted techniques.
- Mark as New
- Bookmark
- Subscribe
- Mute
- Subscribe to RSS Feed
- Permalink
- Notify Moderator
Plotting of polygons by line is easy for Prime 7. However, plotting of closed polygons by color for Prime 7 needs tips.
- Tags:
- Prime_7.0
- Mark as New
- Bookmark
- Subscribe
- Mute
- Subscribe to RSS Feed
- Permalink
- Notify Moderator
Use polar plot
- Mark as New
- Bookmark
- Subscribe
- Mute
- Subscribe to RSS Feed
- Permalink
- Notify Moderator
If you consider R to be the square root of the radius of the circle, you're OK. Otherwise:
Success!
Luc


