- Community
- ThingWorx
- ThingWorx Developers
- APPARENT DEADLOCK Issue
- Subscribe to RSS Feed
- Mark Topic as New
- Mark Topic as Read
- Float this Topic for Current User
- Bookmark
- Subscribe
- Mute
- Printer Friendly Page
APPARENT DEADLOCK Issue
- Mark as New
- Bookmark
- Subscribe
- Mute
- Subscribe to RSS Feed
- Permalink
- Notify Moderator
APPARENT DEADLOCK Issue
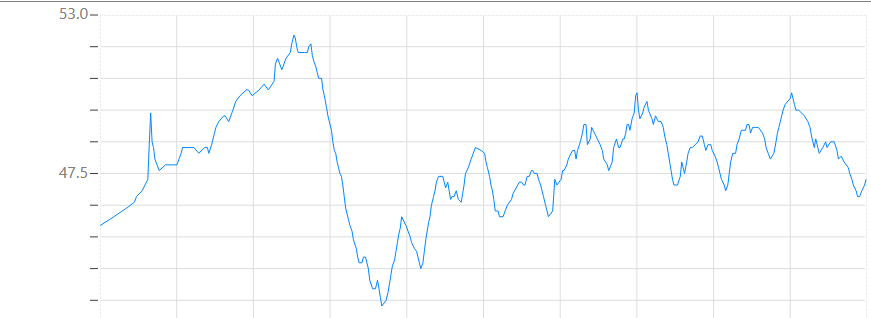
we made chart like following picture.
a chart get about 5000~10000 data.
and divide 500 row using some rule
sometimes when i call this service, thingworx display error log
"com.mchange.v2.async.ThreadPoolAsynchronousRunner$DeadlockDetector@7345aa02 -- APPARENT DEADLOCK!!! Creating emergency threads for unassigned pending tasks!"
why? how to fix it?
i want never see error log again
- Labels:
-
Coding
-
Troubleshooting
- Tags:
- APPARENT DEADLOCK
- Mark as New
- Bookmark
- Subscribe
- Mute
- Subscribe to RSS Feed
- Permalink
- Notify Moderator
Hi @CHASEONHO what kind of service is it? I'm not sure if this is really a deadlock issue could be just because you are doing lot of in-memory calculation which could be leading to out of memory condition.
Would it be possible to attach the tomcat & application log?
- Mark as New
- Bookmark
- Subscribe
- Mute
- Subscribe to RSS Feed
- Permalink
- Notify Moderator
Here are today log file.
my service get infotable about 10000.
and if infotable rows are above 500 it will convert to new infotable under 500 rows
- Mark as New
- Bookmark
- Subscribe
- Mute
- Subscribe to RSS Feed
- Permalink
- Notify Moderator
Thank you @CHASEONHO for attaching the logs how much resource is assigned to the instance running ThingWorx? There's not much but defintely there are some tasks in ValueStream thats queued up.
Which persistence provider are you using for ThingWorx?
- Mark as New
- Bookmark
- Subscribe
- Mute
- Subscribe to RSS Feed
- Permalink
- Notify Moderator
H2 is used.
Is this a problem?
Will it be resolved by increasing the queue to infinity?
- Mark as New
- Bookmark
- Subscribe
- Mute
- Subscribe to RSS Feed
- Permalink
- Notify Moderator
@CHASEONHO I'm still missing information on how much resource you have provided to the ThingWorx instance. Meaning CPU, RAM esp. the one assigned to Tomcat process. etc.
- Mark as New
- Bookmark
- Subscribe
- Mute
- Subscribe to RSS Feed
- Permalink
- Notify Moderator
Wher can i get a information on how much resource you have provided to the ThingWorx instance?
- Mark as New
- Bookmark
- Subscribe
- Mute
- Subscribe to RSS Feed
- Permalink
- Notify Moderator
You can find out if you have defined the initial / max memory parameters for the Tomcat JVM e.g.
-Xms512m
-Xmx1024m
If tomcat is running on windows os you could check the Monitor Tomcat configuration e.g.
BTW, are you using your installation for the production environment?


