- Community
- ThingWorx
- ThingWorx Developers
- Re: Get line for points in XY chart
- Subscribe to RSS Feed
- Mark Topic as New
- Mark Topic as Read
- Float this Topic for Current User
- Bookmark
- Subscribe
- Mute
- Printer Friendly Page
Get line for points in XY chart
- Mark as New
- Bookmark
- Subscribe
- Mute
- Subscribe to RSS Feed
- Permalink
- Notify Moderator
Get line for points in XY chart
Hi Ankit Gupta
There are couple of questions . Please help me .
1) Though the QueryPropertyHistory returned exact values when I executed the service, the values of properties shown on mash up was trimmed one. How can I avoid this? I need exact values. The baseType of property is NUMBER
2) I remember for one of my question How to show Fast Fourier transform for a set of readings from accelerometer in mash up? u had said to use seriesType1 property of the xy widget to line to get a line. I didn't find this in XY chart. Its present only in time series chart. How can I get line view here?
Thanks,
Azim
Solved! Go to Solution.
- Labels:
-
Troubleshooting
Accepted Solutions
- Mark as New
- Bookmark
- Subscribe
- Mute
- Subscribe to RSS Feed
- Permalink
- Notify Moderator
Try setting Yaxisformat property of TimeSeries Chart to something like 0000.00000
- Mark as New
- Bookmark
- Subscribe
- Mute
- Subscribe to RSS Feed
- Permalink
- Notify Moderator
For Query 1:
Grid widget has the option to format the Columns. Go to Dropdown->configure Grid columns.
Select the Property and open Column Renderer & State Formatting tab.
Change the Format according to your requirement.
- Mark as New
- Bookmark
- Subscribe
- Mute
- Subscribe to RSS Feed
- Permalink
- Notify Moderator
Hi Ankit Gupta,
I need to display exact values on time series chart. Not on the grid widget. Please help me to achieve the same on time series chart.
Thanks,
Azim
- Mark as New
- Bookmark
- Subscribe
- Mute
- Subscribe to RSS Feed
- Permalink
- Notify Moderator
Try setting Yaxisformat property of TimeSeries Chart to something like 0000.00000
- Mark as New
- Bookmark
- Subscribe
- Mute
- Subscribe to RSS Feed
- Permalink
- Notify Moderator
Hi Ankit Gupta,
Thanks this helped me . I have marked your answer as correct answer. Also is there a way to debug mashup? Where can I find logs if there is anything wrong in mashup configuration?
Thanks,
Azim
- Mark as New
- Bookmark
- Subscribe
- Mute
- Subscribe to RSS Feed
- Permalink
- Notify Moderator
Hi azim hawaldar,
Great! I am glad it helped.
When we view Mashup; we get option for Show/Hide Log and Show/Hide Debug Info. Is that what you are looking for?
- Mark as New
- Bookmark
- Subscribe
- Mute
- Subscribe to RSS Feed
- Permalink
- Notify Moderator
Hi Ankit Gupta,
I dont think Show/Hide Log and Show/Hide Debug Info options will help me. Because, this will be helpful when once mashup is configure properly. But, if mashup configuration itself is wrong, then how did I get to know where is the configuration issue.
Thanks,
Azim
- Mark as New
- Bookmark
- Subscribe
- Mute
- Subscribe to RSS Feed
- Permalink
- Notify Moderator
azim hawaldar, Can you give me an example; for anything wrong in mashup configuration to help me understand the requirement more clearly?
- Mark as New
- Bookmark
- Subscribe
- Mute
- Subscribe to RSS Feed
- Permalink
- Notify Moderator
Hi Ankit Gupta,
Consider my previous query on
Display Data on Mashup Composer, from remote devices you said that baseType has to be Number rather than String for time series chart. So. how can I get to know that the baseType has to be Number rather than String . Hope you got it know.
Thanks,
Azim
- Mark as New
- Bookmark
- Subscribe
- Mute
- Subscribe to RSS Feed
- Permalink
- Notify Moderator
The input of TimeSeries Chart is an infotable so the configuration was correct and Mashup Builder will not allow us to bind data other then infotable to timeSeriesChart.
But after linking the data we will get an empty dropdown for series which indicates that there is no compatible column in the infotable that can be shown in TimeSeries chart.
As per my knowledge; there are no separate logs for incorrect configuration.
I hope it helps.
- Mark as New
- Bookmark
- Subscribe
- Mute
- Subscribe to RSS Feed
- Permalink
- Notify Moderator
For Query2:
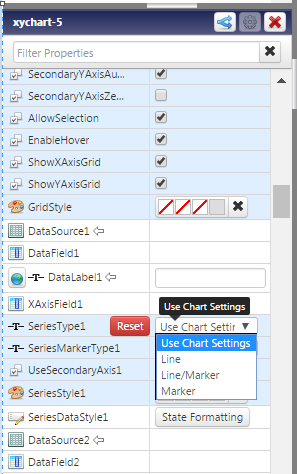
I can find the SeriesType1 property in xy chart widget properties. Are you using version 2 charts?

- Mark as New
- Bookmark
- Subscribe
- Mute
- Subscribe to RSS Feed
- Permalink
- Notify Moderator
HI Ankit Gupta,
For a plain XY chart widget, i.e. no binding has done yet, I can see this SeriesType1 property in xy chart widget properties. Once I bind All Data of returned data from QueryPropertyHistory, this SeriesType1 becomes invisible.

- Mark as New
- Bookmark
- Subscribe
- Mute
- Subscribe to RSS Feed
- Permalink
- Notify Moderator
Hi azim hawaldar,
Use Label chart and bind data with X and Y axis column
Set chart property as following:
Chart Type: Line
XAxisField: X axis column
DataField1: Y axis column
View the chart:

- Mark as New
- Bookmark
- Subscribe
- Mute
- Subscribe to RSS Feed
- Permalink
- Notify Moderator
Thanks Ankit for sharing this ideas.
- Mark as New
- Bookmark
- Subscribe
- Mute
- Subscribe to RSS Feed
- Permalink
- Notify Moderator
- Mark as New
- Bookmark
- Subscribe
- Mute
- Subscribe to RSS Feed
- Permalink
- Notify Moderator
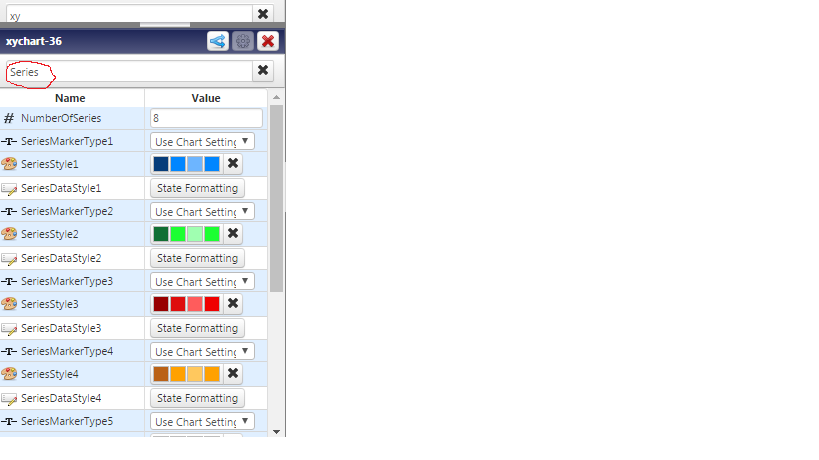
Ankit Gupta I am seeking assistance on how to plot two XY series in label plot as they are coming different sources.
- Mark as New
- Bookmark
- Subscribe
- Mute
- Subscribe to RSS Feed
- Permalink
- Notify Moderator
Hi Harish Kumar,
The XY chart widget does not take multiple data source. So, you have three options:
1. Create separate charts for each series.
2. If the Thing Template of the Things is same; you can use GetImplementingThingWithData Service with Dynamic services to show different series in the same chart based on which Thing is currently selected. This is explained in Detail in the ThingWorx Foundation Training.
3. Combine the Data into single Infotable in a Service and use it in your Mashup. If the amount of data is high; this option could result in Performance issue.


