- Community
- ThingWorx
- ThingWorx Developers
- Re: Is there any way to include amcharts in Thingw...
- Subscribe to RSS Feed
- Mark Topic as New
- Mark Topic as Read
- Float this Topic for Current User
- Bookmark
- Subscribe
- Mute
- Printer Friendly Page
Is there any way to include amcharts in Thingworx?
- Mark as New
- Bookmark
- Subscribe
- Mute
- Subscribe to RSS Feed
- Permalink
- Notify Moderator
Is there any way to include amcharts in Thingworx?
I have a requirement to include am charts in the thingworx. Is this possible by including amchart libraries and creating new custom widgets? Any insight in this would be helpful.
Solved! Go to Solution.
- Labels:
-
Coding
-
Mashup-Widget
-
TWX Dev Portal
Accepted Solutions
- Mark as New
- Bookmark
- Subscribe
- Mute
- Subscribe to RSS Feed
- Permalink
- Notify Moderator
Thanks for your reply. Giving the values in px was an effective way to define the size of the chart. In addition to that the size was suppose to be defined in the runtime.css file.
For community,
I have included the zip file of a sample widget for future reference.
- Mark as New
- Bookmark
- Subscribe
- Mute
- Subscribe to RSS Feed
- Permalink
- Notify Moderator
Hi @Vatsal.
It is possible to include these libraries to the ThingWorx platform, but not something we have tested or would support. For creating new custom widgets, please refer to this documentation.
It's recommended that with any new libraries, you fully test your functionality to ensure there are no conflicts with existing libraries.
Regards.
--Sharon
- Mark as New
- Bookmark
- Subscribe
- Mute
- Subscribe to RSS Feed
- Permalink
- Notify Moderator
Thanks a lot for your reply @slangley .
I tried creating a chart widget using the amChart libraries and was able to do so.
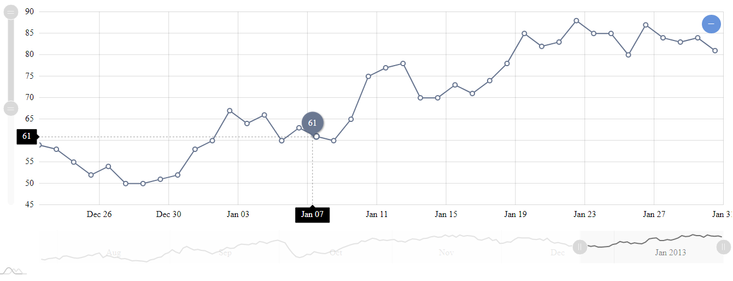
However the rendering is not doe properly in Thingworx. I have attached the screenshots of the rendered images when the chart is made in HTML(amChartHTML.png)
and when it is made in Thingworx(amChartTW.png).
I have also uploaded the runtime.js file i am using in the TW widget. In case you can identify if i am missing anything kindly let me know.
- Mark as New
- Bookmark
- Subscribe
- Mute
- Subscribe to RSS Feed
- Permalink
- Notify Moderator
Hello,
Just few observations:
- It looks like the chart is squeezed into a container which is too small. This is something you can confirm by checking DOM hierarchy in Chrome Dev Tools;
- The chartContainer (together with the corresponding div) seems to be unnecessary;
- What if you try to set width on the div you render?
/ Constantine
- Mark as New
- Bookmark
- Subscribe
- Mute
- Subscribe to RSS Feed
- Permalink
- Notify Moderator
Thanks for your reply @Constantine .
I tried to add the width and height of the chart in terms of percentage while creating the chart element.
This addition has resulted in the reflection of width for the chart element, but the height is not getting reflected. You can refer to #line27 of the included txt file.
This is the result after the changes are made.
If the height is increased to 150%, below is the result: The height of the chart is increased, but the element to control the x axis is not visible(The light grey graph line in the above image).
How can i increase the size of the container in which the chart is added?
- Mark as New
- Bookmark
- Subscribe
- Mute
- Subscribe to RSS Feed
- Permalink
- Notify Moderator
Vatsal,
I'm really not an expert in UI extensions, but since you don't get other replies, I can only suggest looking at how other extensions implement it. If I remember correctly (and I might be completely wrong here), the widget's Height property is somehow calculated automatically based on the layouts, and then this value (in pixels) can be used instead of "100%". Sorry, cannot verify it right now.
/ Constantine
- Mark as New
- Bookmark
- Subscribe
- Mute
- Subscribe to RSS Feed
- Permalink
- Notify Moderator
Thanks for your reply. Giving the values in px was an effective way to define the size of the chart. In addition to that the size was suppose to be defined in the runtime.css file.
For community,
I have included the zip file of a sample widget for future reference.


