Hello All,
I was able to get it working!
I only needed to use one data series, which I got from pulling the data from a Value Stream:
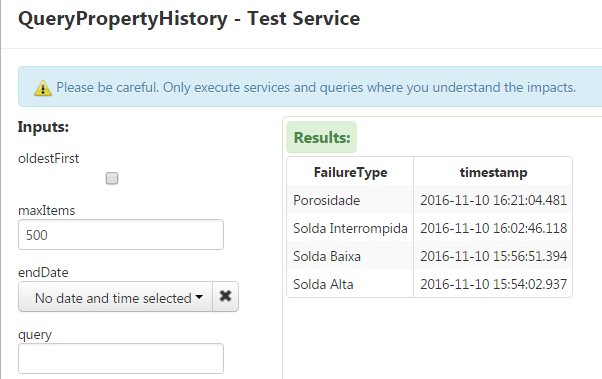
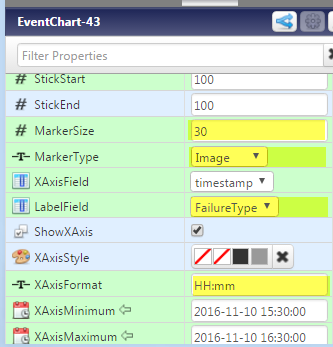
There is some configuration on the widget to be done but once I figure it would it was really easy:
Main trick was to change the marker size to control the Icon Size. Its default value is 3 so the icons are tiny.
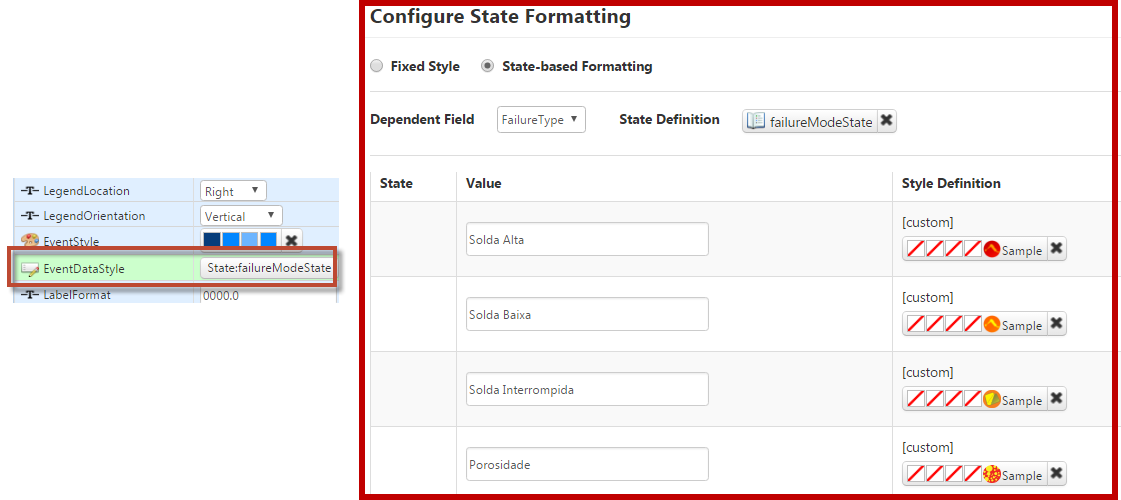
Then I applied some State Based Formatting:
The result (not final) is something like this:
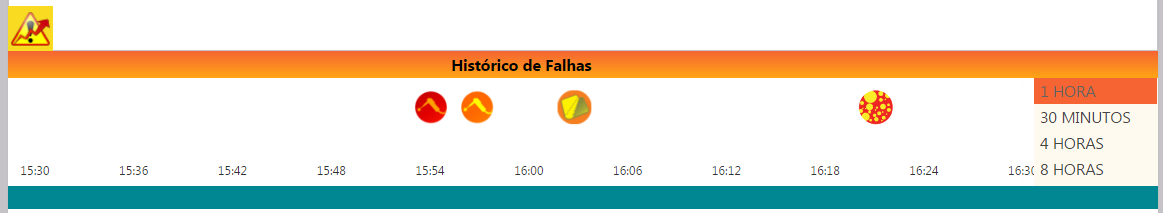
Every icon in the timeline is a different type of issue
Thanks Carles Coll and Bogdan Mihaiciuc for the tips.
Cheers
Ewerton

