- Community
- ThingWorx
- ThingWorx Developers
- Time series chart v2 not showing data?
- Subscribe to RSS Feed
- Mark Topic as New
- Mark Topic as Read
- Float this Topic for Current User
- Bookmark
- Subscribe
- Mute
- Printer Friendly Page
Time series chart v2 not showing data?
- Mark as New
- Bookmark
- Subscribe
- Mute
- Subscribe to RSS Feed
- Permalink
- Notify Moderator
Time series chart v2 not showing data?
I have a service that return data with fields
1-time
2-status (some numeric value)
3- id
as shown in the attachment
the result of the service is represented by time series chart default
but the time series chart v2 is blank
both the charts are binded with the same service
any help?
I am not able to figure why its is not showing the data
I have set the x axis field and data field
- Labels:
-
Extensions
- Mark as New
- Bookmark
- Subscribe
- Mute
- Subscribe to RSS Feed
- Permalink
- Notify Moderator
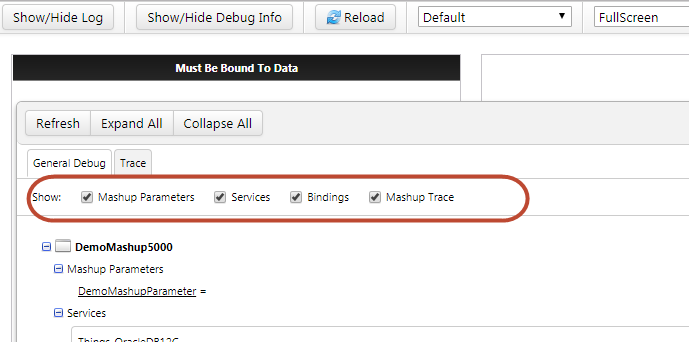
Hi Jugal, could you enable the Show Debug tool when you view the Mashup and check for the services and the bindings, make sure to enable the parameters
Alternatively you can also check via the Chrome's Developer Tool to see if it's showing any error to quickly highlight the issues

- Mark as New
- Bookmark
- Subscribe
- Mute
- Subscribe to RSS Feed
- Permalink
- Notify Moderator
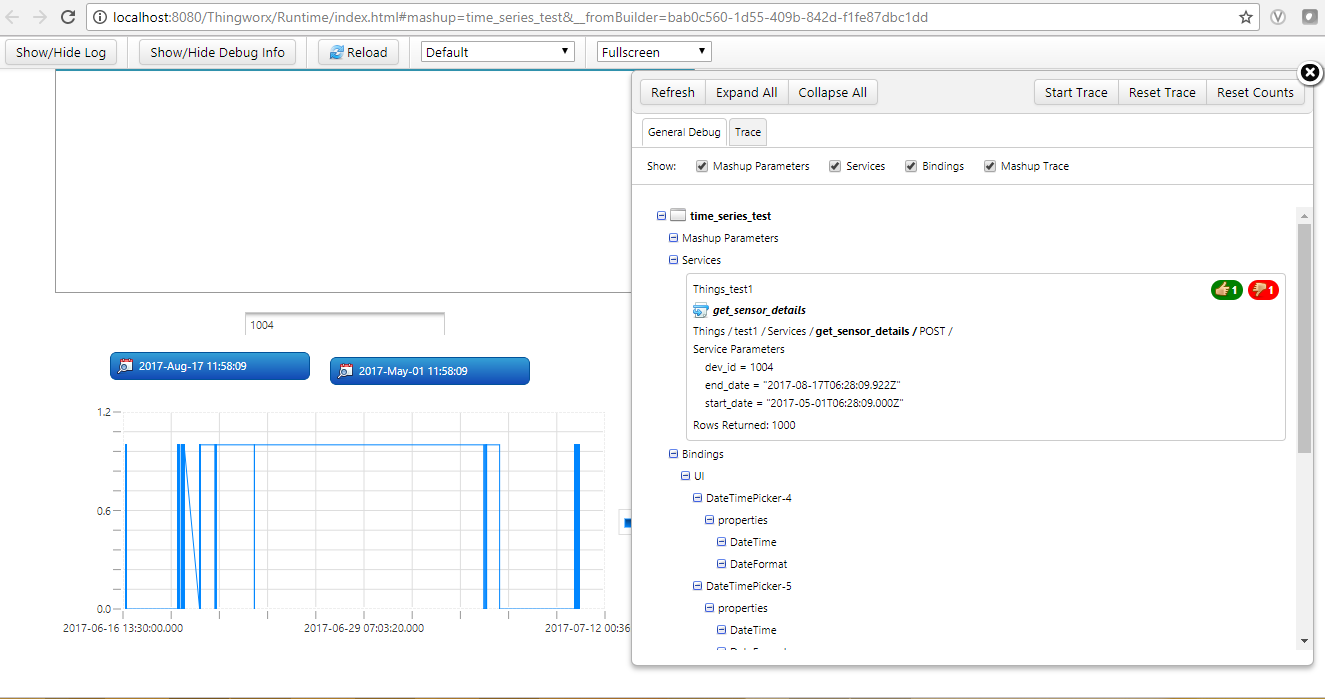
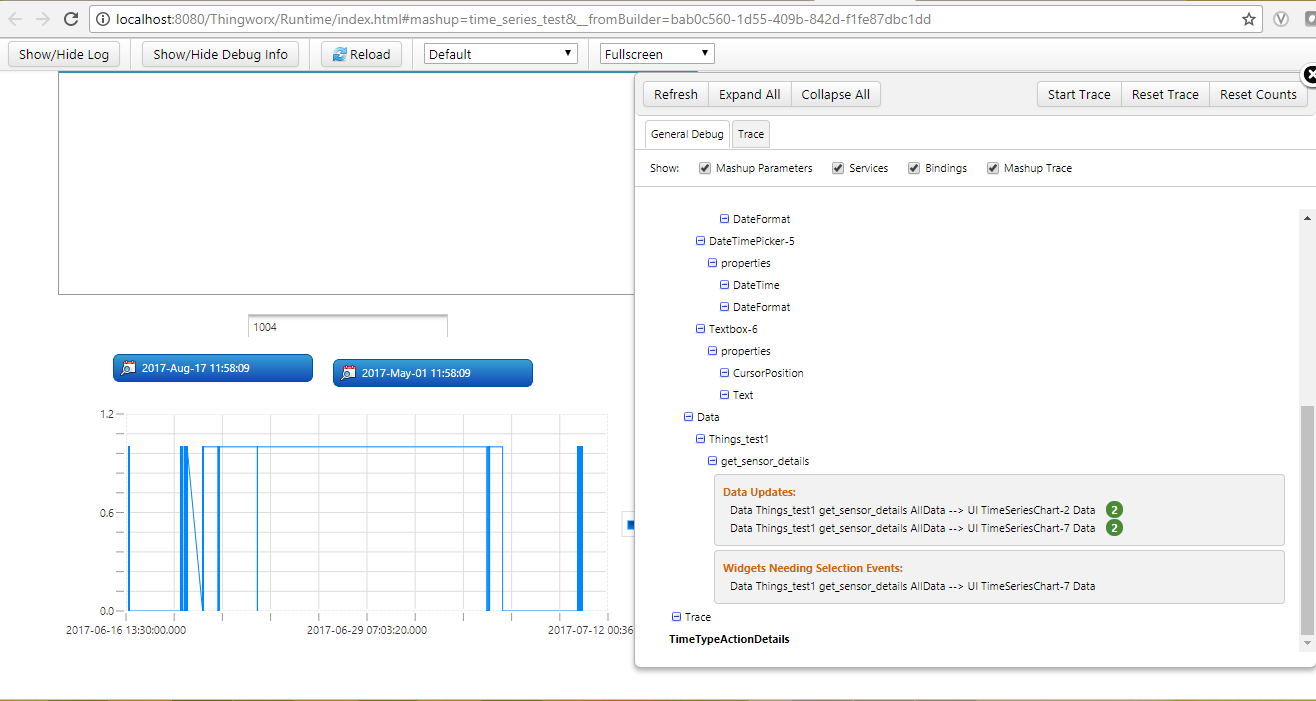
This is the debug data of my mashup
I have never used it previously so don't understand it much


- Mark as New
- Bookmark
- Subscribe
- Mute
- Subscribe to RSS Feed
- Permalink
- Notify Moderator
Jugal, as you can see the service works fine for one as you get that green thumbs up and same service shows thumbs down in red, did you check the ApplicationLog or the browser's developer console for more specific detail?
- Mark as New
- Bookmark
- Subscribe
- Mute
- Subscribe to RSS Feed
- Permalink
- Notify Moderator
[context: com.thingworx.webservices.context.HttpExecutionContext@16479d39][message: Unable To Parse JSON Request]
this is logged in the application log
when I searched the error on internet
it shows number of digits is greater that 20 for number type
but as I ran the service no such number is big
- Mark as New
- Bookmark
- Subscribe
- Mute
- Subscribe to RSS Feed
- Permalink
- Notify Moderator
Jugal, could also check the scriptLog, this error could happen for variety of reasons may be the Datashape you have assigned to the output for your service is not conducive to what is expected by the TimeSeries Chart v2, in case you don't see more information in script log either, you can enable the stack tracing on your service by navigating to the System > Subsystems > Logging Subsystem > Configuration and then enable the the Stack trace save the configuration and reload the mashup. Then disable the stack tracing and check for the ApplicationLog, ScriptLog and ErrorLog (stack trace is logged in ErrorLog.)
May be you can also share the findings here.
- Mark as New
- Bookmark
- Subscribe
- Mute
- Subscribe to RSS Feed
- Permalink
- Notify Moderator
Was a resolution found for this? I am experiencing the same issue.
- Mark as New
- Bookmark
- Subscribe
- Mute
- Subscribe to RSS Feed
- Permalink
- Notify Moderator
Hi @jshah-3
Hope you are doing good. Could you please reply on this.
If the issue has been resolved please mark the answer as accept as solution. So that other can take benefit for the same issue. Thank you in advance.
Regards-Mohit Goel


