
Turn on suggestions
Auto-suggest helps you quickly narrow down your search results by suggesting possible matches as you type.
Showing results for
Please log in to access translation
Turn on suggestions
Auto-suggest helps you quickly narrow down your search results by suggesting possible matches as you type.
Showing results for
Community Tip - Did you get called away in the middle of writing a post? Don't worry you can find your unfinished post later in the Drafts section of your profile page. X
- Community
- Augmented Reality
- Vuforia Studio
- Re: Adjust and Configure Time Series Chart
Translate the entire conversation x
Please log in to access translation
Options
- Subscribe to RSS Feed
- Mark Topic as New
- Mark Topic as Read
- Float this Topic for Current User
- Bookmark
- Subscribe
- Mute
- Printer Friendly Page
Adjust and Configure Time Series Chart
Aug 04, 2020
08:53 AM
- Mark as New
- Bookmark
- Subscribe
- Mute
- Subscribe to RSS Feed
- Permalink
- Notify Moderator
Please log in to access translation
Aug 04, 2020
08:53 AM
Adjust and Configure Time Series Chart
Hi everyone,
I am struggling with configuring the time series chart in my vuforia studio. I don't know why the chart doesn't start with the first timestamp. The chart doesn't look good because the data is on the right side. The left side of the chart is blank because there is no data. I use QueryPropertyHistory to populate the data. I have checked that the returned data is correct. How to configure the timestamp on the time series chart?
Solved! Go to Solution.
Labels:
- Labels:
-
Design
-
Mashup-Widget
-
Troubleshooting
ACCEPTED SOLUTION
Accepted Solutions
Aug 06, 2020
09:43 AM
- Mark as New
- Bookmark
- Subscribe
- Mute
- Subscribe to RSS Feed
- Permalink
- Notify Moderator
Please log in to access translation
Aug 06, 2020
09:43 AM
Hi @evanfebrianto ,
tested the service QueryPropertyHistory with a Time Series Chart feature and it seem to work ok.
I used TWX object RobotArm1 with some logged properties /values are saved to a stream. I tested the service in TWX platform QueryPropertyHistroy to see if I could achieve also in TWX view the desired results:

The added the RootArm1 object to the external data section and added the service QueryPropertyHistroy.
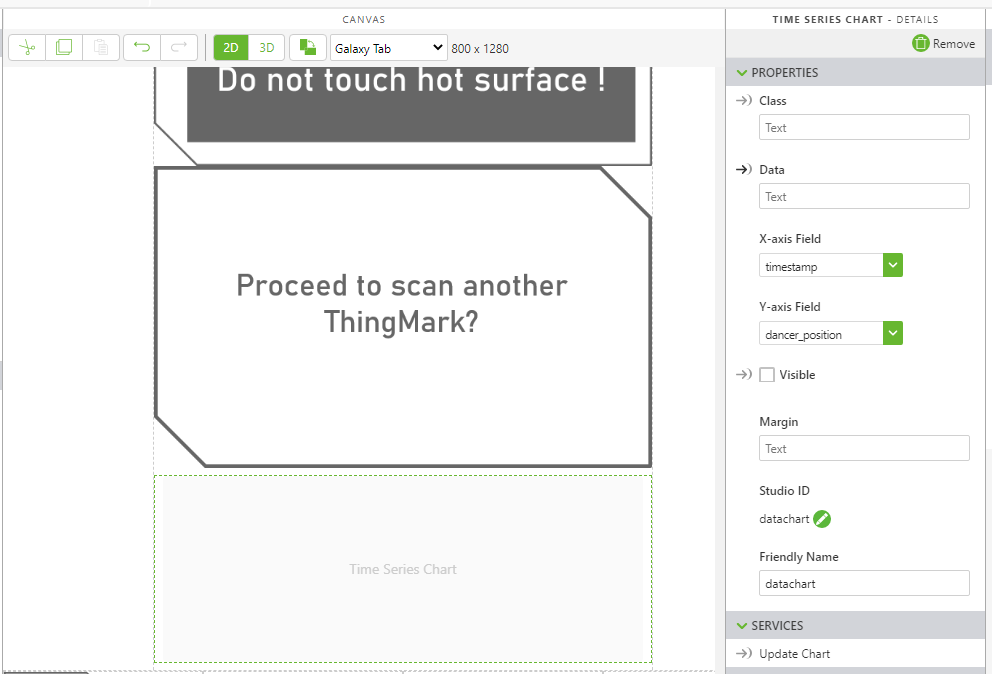
Then created the following links to the time series widget /respectively did the property setting:

So set the filed for X and Y axis and the parameters for the execution of the service.
Added a link of the serviceInvoceComplete to the update Chart Widget event. Then it was working fine.
So have the following display in preview mode:

1 REPLY 1
Aug 06, 2020
09:43 AM
- Mark as New
- Bookmark
- Subscribe
- Mute
- Subscribe to RSS Feed
- Permalink
- Notify Moderator
Please log in to access translation
Aug 06, 2020
09:43 AM
Hi @evanfebrianto ,
tested the service QueryPropertyHistory with a Time Series Chart feature and it seem to work ok.
I used TWX object RobotArm1 with some logged properties /values are saved to a stream. I tested the service in TWX platform QueryPropertyHistroy to see if I could achieve also in TWX view the desired results:
The added the RootArm1 object to the external data section and added the service QueryPropertyHistroy.
Then created the following links to the time series widget /respectively did the property setting:
So set the filed for X and Y axis and the parameters for the execution of the service.
Added a link of the serviceInvoceComplete to the update Chart Widget event. Then it was working fine.
So have the following display in preview mode:


