- Subscribe to RSS Feed
- Mark Topic as New
- Mark Topic as Read
- Float this Topic for Current User
- Bookmark
- Subscribe
- Mute
- Printer Friendly Page
Using colormaps in matrix Pictures
- Mark as New
- Bookmark
- Subscribe
- Mute
- Subscribe to RSS Feed
- Permalink
- Notify Moderator
Using colormaps in matrix Pictures
There are many limitations in Mathcad's graphics capabilities (and a corresponding list of feature requests to improve them). Most of the time I just work around these limitations using standard techniques or just sigh and move on ("nothing to see,move along folks..."). However, every once in a while I get sufficiently irritated to do something about it.
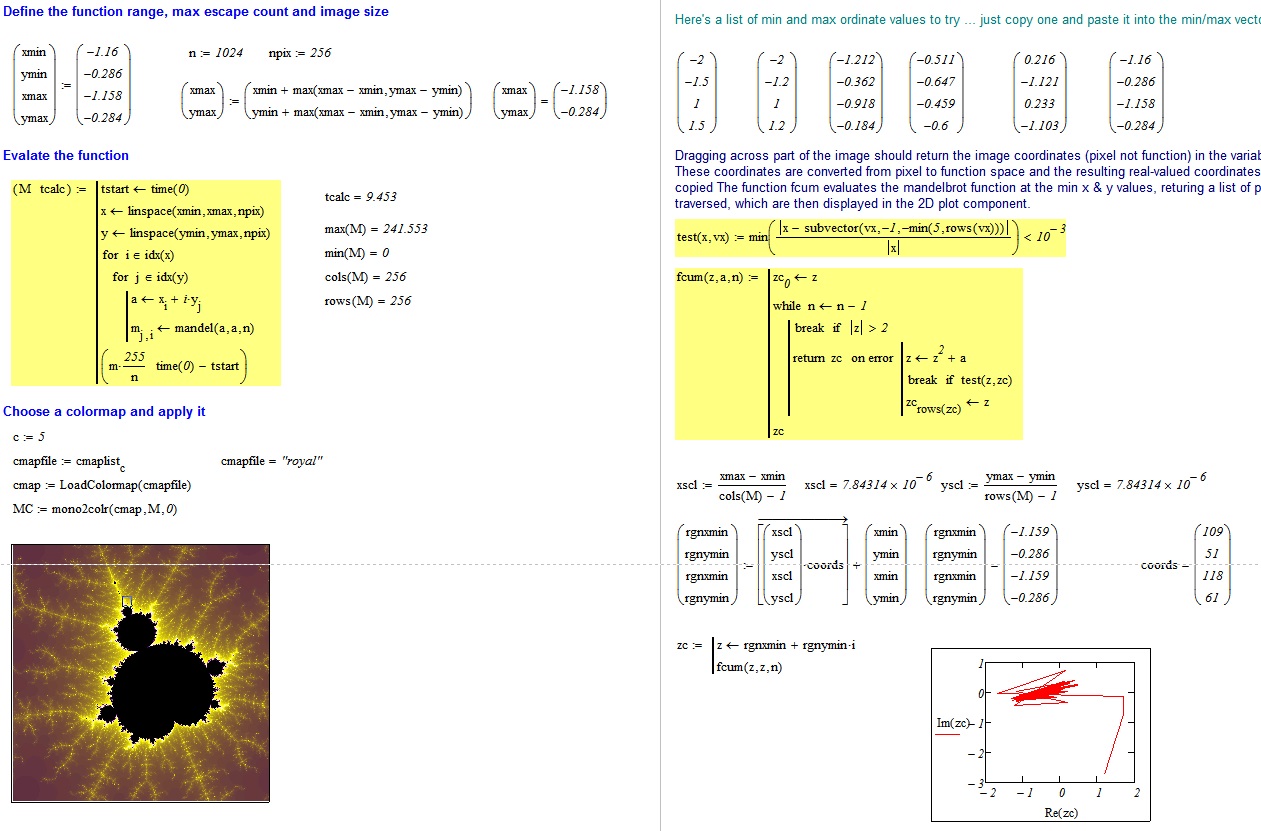
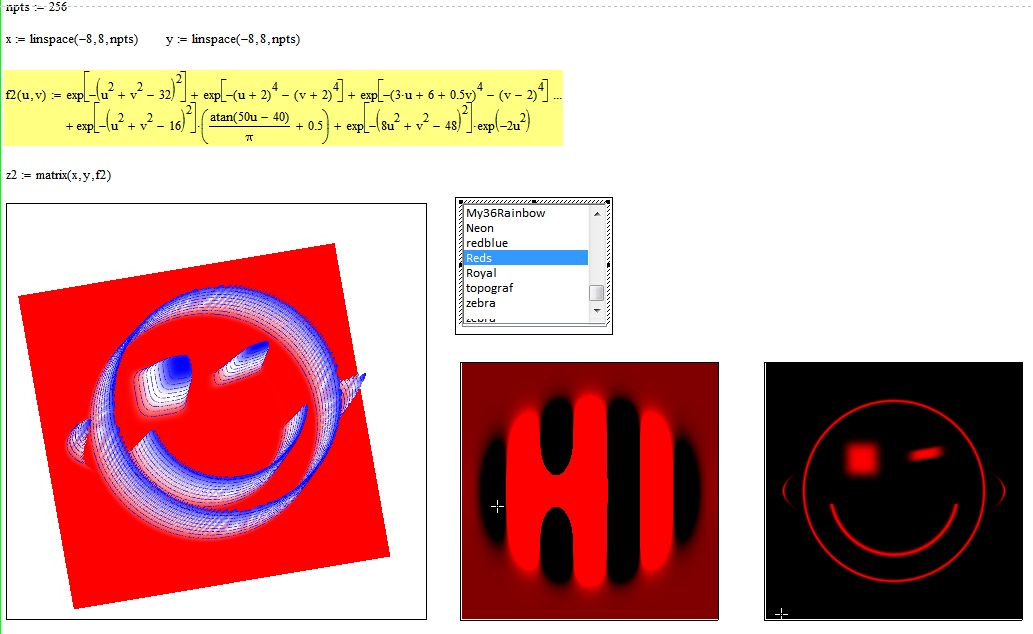
In this case, I wanted to have color the mandelbrot set and didn't much like the display in 3D, so I wrote a function to use the 3D colormaps to colour a 2D image matrix for display in the Picture component. The worksheet also contains an animation.
However, I also have a memory like a something or other, I forget what. Checking after I'd written the attached worksheet, it turns out that this problem has arisen before and dpsycho posted an example that replicates the Rainbow map and I also found some other of my worksheets that created custom colormaps.
Stuart

- Labels:
-
Statistics_Analysis
- Mark as New
- Bookmark
- Subscribe
- Mute
- Subscribe to RSS Feed
- Permalink
- Notify Moderator
I like it.
- Mark as New
- Bookmark
- Subscribe
- Mute
- Subscribe to RSS Feed
- Permalink
- Notify Moderator
Great sheet, as usual!
It looks to me as if your utilities section has grown again - very helpful and much appreciated.
Thanks!
Werner
- Mark as New
- Bookmark
- Subscribe
- Mute
- Subscribe to RSS Feed
- Permalink
- Notify Moderator
Stuart,
Thanks!
- Mark as New
- Bookmark
- Subscribe
- Mute
- Subscribe to RSS Feed
- Permalink
- Notify Moderator
Thank you all, but unfortunately there is an error in the interpolation method. I'll post a revised one later on.
Stuart
- Mark as New
- Bookmark
- Subscribe
- Mute
- Subscribe to RSS Feed
- Permalink
- Notify Moderator
- Mark as New
- Bookmark
- Subscribe
- Mute
- Subscribe to RSS Feed
- Permalink
- Notify Moderator
Thanks a lot!
- Mark as New
- Bookmark
- Subscribe
- Mute
- Subscribe to RSS Feed
- Permalink
- Notify Moderator
Slightly modified version ...

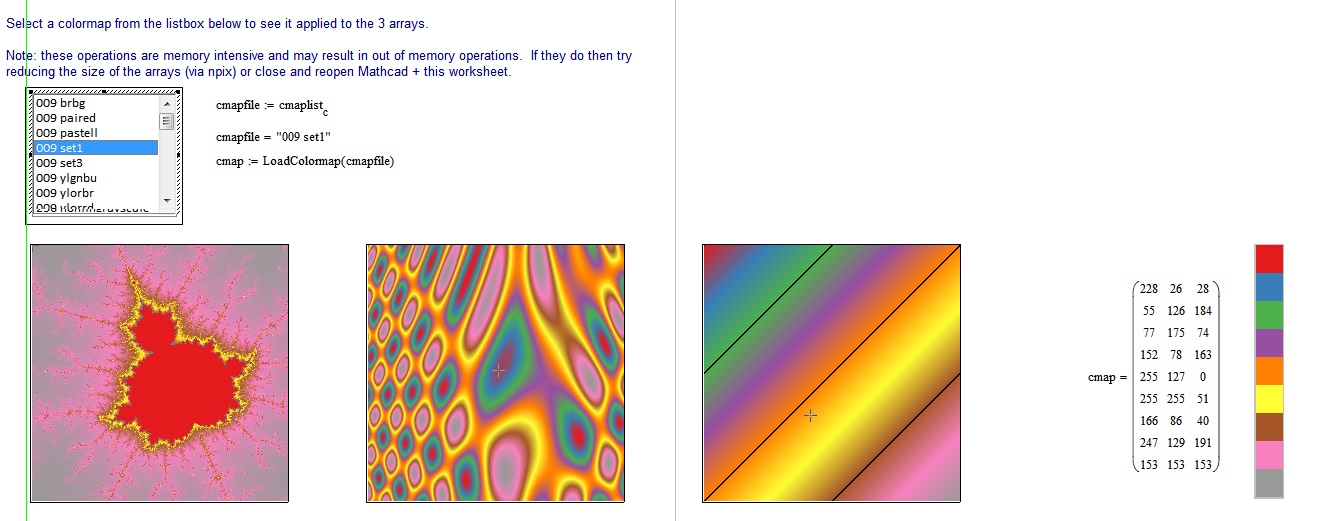
It's interesting to note how much difference choice of colormap makes in bringing out the structure of images; any give colormap can be very good for one image and useless for another.
- Mark as New
- Bookmark
- Subscribe
- Mute
- Subscribe to RSS Feed
- Permalink
- Notify Moderator
Great worksheet! Somehow (i.e. too much work to do) I missed this thread.
- Mark as New
- Bookmark
- Subscribe
- Mute
- Subscribe to RSS Feed
- Permalink
- Notify Moderator
Looks great!


