Using colormaps in matrix Pictures
There are many limitations in Mathcad's graphics capabilities (and a corresponding list of feature requests to improve them). Most of the time I just work around these limitations using standard techniques or just sigh and move on ("nothing to see,move along folks..."). However, every once in a while I get sufficiently irritated to do something about it.
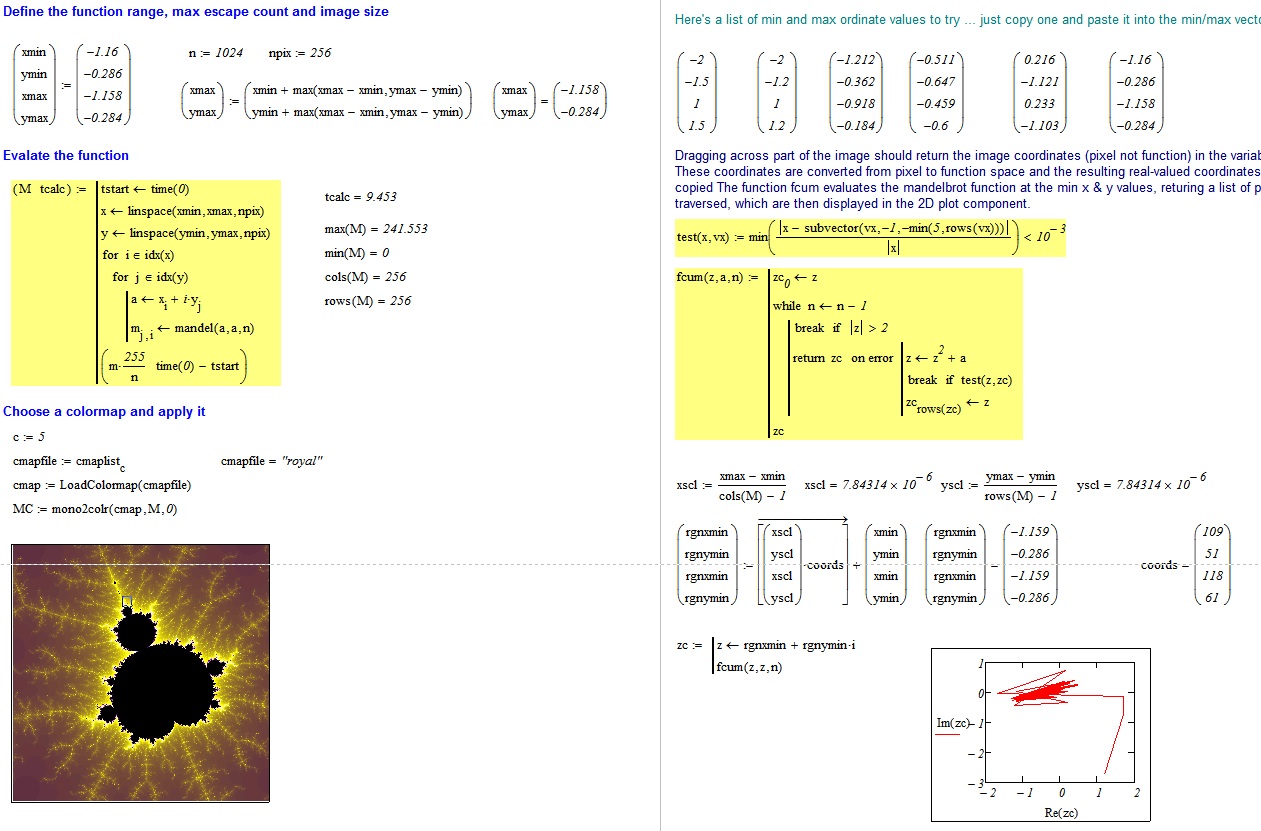
In this case, I wanted to have color the mandelbrot set and didn't much like the display in 3D, so I wrote a function to use the 3D colormaps to colour a 2D image matrix for display in the Picture component. The worksheet also contains an animation.
However, I also have a memory like a something or other, I forget what. Checking after I'd written the attached worksheet, it turns out that this problem has arisen before and dpsycho posted an example that replicates the Rainbow map and I also found some other of my worksheets that created custom colormaps.
Stuart