Community Tip - Did you get an answer that solved your problem? Please mark it as an Accepted Solution so others with the same problem can find the answer easily. X
- Subscribe to RSS Feed
- Mark Topic as New
- Mark Topic as Read
- Float this Topic for Current User
- Bookmark
- Subscribe
- Mute
- Printer Friendly Page
3D Plots
- Mark as New
- Bookmark
- Subscribe
- Mute
- Subscribe to RSS Feed
- Permalink
- Notify Moderator
3D Plots
I am trying to learn to make 3D plots and got stuck immediately on a simple example - see attached worksheet. Can someone help me get started? More generally, is there a better resource than the MC quicksheet, which I found to be minimally helpful?
Thanks.
Solved! Go to Solution.
Accepted Solutions
- Mark as New
- Bookmark
- Subscribe
- Mute
- Subscribe to RSS Feed
- Permalink
- Notify Moderator
Glad you got what you were hunting for.
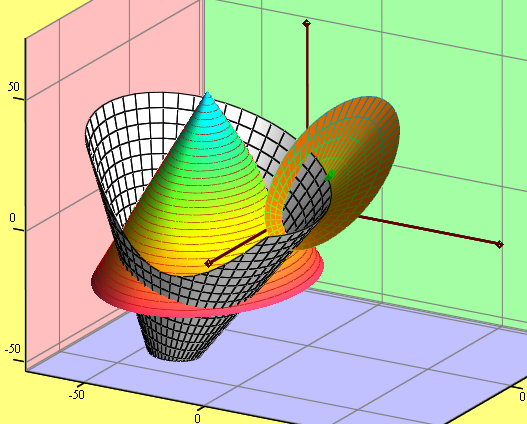
Here is a more generic routine to generate a cone along with an animation to explain the arguments of the function.

- Mark as New
- Bookmark
- Subscribe
- Mute
- Subscribe to RSS Feed
- Permalink
- Notify Moderator
In your first plot there is no easy way to make the edge circular. However, other than a small detail, you got it in the second plot. It you put F1, F2, F3 in the placeholder then Mathcad interprets that as three plots, where the the z values are given by F1, F2, and F3, and the x and y values are the points on a rectangular x-y grid, determined by the quickplot parameters. If you replace that with (F1, F2, F3) Mathcad interprets that as a single plot where the x, y, and z values are given by F1, F2, and F3. Then you will see what you are looking for.
- Mark as New
- Bookmark
- Subscribe
- Mute
- Subscribe to RSS Feed
- Permalink
- Notify Moderator
John Rudnicki wrote:
I am trying to learn to make 3D plots and got stuck immediately on a simple example - see attached worksheet. Can someone help me get started? More generally, is there a better resource than the MC quicksheet, which I found to be minimally helpful?
Usually I have found the help pages of Mathcad in addition with the quicksheets very helpful and quite comprehensive. Maybe its a good idea to work through all the examples first and then try something on your own.
In the first plot you can uncheck Auto Scale for the z-axis and set an appropriate value for the minimum and maximum value of z to get the circular edge you want to see.
You may find it more useful to create a vector function and use CreateMesh() for more flexibility and less need to change parameters like the grid size in the format menu.
The attached file should help.
- Mark as New
- Bookmark
- Subscribe
- Mute
- Subscribe to RSS Feed
- Permalink
- Notify Moderator
In the first plot you can uncheck Auto Scale for the z-axis and set an appropriate value for the minimum and maximum value of z to get the circular edge you want to see.
OK, OK. So there is an easy way to get a circular edge on the first plot ![]() . In my defense, I never use the 3D quickplot (or, for that matter, the 2D quickplot) for anything. They are more trouble than they are worth.
. In my defense, I never use the 3D quickplot (or, for that matter, the 2D quickplot) for anything. They are more trouble than they are worth.
- Mark as New
- Bookmark
- Subscribe
- Mute
- Subscribe to RSS Feed
- Permalink
- Notify Moderator
Richard Jackson wrote:
In the first plot you can uncheck Auto Scale for the z-axis and set an appropriate value for the minimum and maximum value of z to get the circular edge you want to see.OK, OK. So there is an easy way to get a circular edge on the first plot
. In my defense, I never use the 3D quickplot (or, for that matter, the 2D quickplot) for anything. They are more trouble than they are worth.
I also wouldn't recommend doing so and prefer the parametric representation of the cone in combination with CreateMesh.
- Mark as New
- Bookmark
- Subscribe
- Mute
- Subscribe to RSS Feed
- Permalink
- Notify Moderator
Thanks RJ and WE.
WE: Your worksheet was helpful. Sounds like learning to use CreateMesh is the better way to go.
- Mark as New
- Bookmark
- Subscribe
- Mute
- Subscribe to RSS Feed
- Permalink
- Notify Moderator
THanks again. Using CreateMesh and fmap was a simple way to do what I wanted. I can now do same thing for other surfaces of revolution.
- Mark as New
- Bookmark
- Subscribe
- Mute
- Subscribe to RSS Feed
- Permalink
- Notify Moderator
Glad you got what you were hunting for.
Here is a more generic routine to generate a cone along with an animation to explain the arguments of the function.

- Mark as New
- Bookmark
- Subscribe
- Mute
- Subscribe to RSS Feed
- Permalink
- Notify Moderator
Thanks for the routine and the animated illustration. I can understand how to use the routine and (mostly) how it works. Something that I did not understand was how the axes plot (both the cone axis and the black rectangular axes) and why the order matters in the plot arguments; eg. "ax, C1, cax1" vs. "ax, cax1,C1".
- Mark as New
- Bookmark
- Subscribe
- Mute
- Subscribe to RSS Feed
- Permalink
- Notify Moderator
John Rudnicki wrote:
Thanks for the routine and the animated illustration. I can understand how to use the routine and (mostly) how it works. Something that I did not understand was how the axes plot (both the cone axis and the black rectangular axes) and why the order matters in the plot arguments; eg. "ax, C1, cax1" vs. "ax, cax1,C1".
To plot a polygon in 3D you have to provide a vector with three elements. Those elements are vectors again, consisting of the x, y, and z-coordinates of the vertices of that polygon. If you want a closed polygon you have to provide the first point as last point, too. For the axis I created a datstructure with five points. Starting at the "end" of the x-axis to the origin, to the "end" of the y-axis, back to the origin and the to the end of the z-axis.
Similar the data structure for the cone axis which is M12 in the routine provided. Simply two points.
BTW, if you want to draw one single point in 3D (lets say the point of intersectio of three planes or whatever) you have to provide that very datastructure again: A 3x1 vector consisting of three 1x1 vectors.
The important thing is that those polygon plots have to be formatted as "Data Points"/Scatter plot" /the name changes now and then for reasons unknown to me) in the 3Dplot format menu. There is a bug in the 3DPlot component and when ScatterPlot does not work, chose VectorFieldPlot, press OK or Apply and then change it back to "ScatterPlot". Then in tab appearance you chose to draw lines and/or points, color and size.
I don't know why you think that the order matters that much - maybe thats because you forgot to change the plot type,(Scatter vs Surface) too, when you changed the order.
You might also create a data structure like in the attached sheet, where 3D-ploting ax would result in three different plots which can be formatted differently and so you can color the axis differently for better view.

- Mark as New
- Bookmark
- Subscribe
- Mute
- Subscribe to RSS Feed
- Permalink
- Notify Moderator
Many thanks (again!).


