15-Moonstone
February 6, 2015
Solved
3D Plots
- February 6, 2015
- 2 replies
- 5874 views
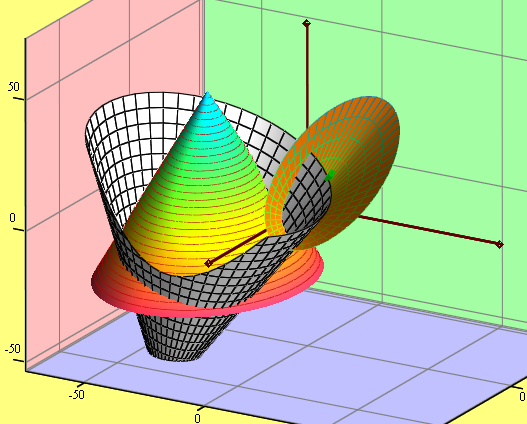
I am trying to learn to make 3D plots and got stuck immediately on a simple example - see attached worksheet. Can someone help me get started? More generally, is there a better resource than the MC quicksheet, which I found to be minimally helpful?
Thanks.