
Turn on suggestions
Auto-suggest helps you quickly narrow down your search results by suggesting possible matches as you type.
Showing results for
Please log in to access translation
Turn on suggestions
Auto-suggest helps you quickly narrow down your search results by suggesting possible matches as you type.
Showing results for
Community Tip - Need to share some code when posting a question or reply? Make sure to use the "Insert code sample" menu option. Learn more! X
Translate the entire conversation x
Please log in to access translation
Options
- Subscribe to RSS Feed
- Mark Topic as New
- Mark Topic as Read
- Float this Topic for Current User
- Bookmark
- Subscribe
- Mute
- Printer Friendly Page
3D plot smoothing: How representative is it of the real data?
Jul 26, 2018
09:32 AM
- Mark as New
- Bookmark
- Subscribe
- Mute
- Subscribe to RSS Feed
- Permalink
- Notify Moderator
Please log in to access translation
Jul 26, 2018
09:32 AM
3D plot smoothing: How representative is it of the real data?
Hello,
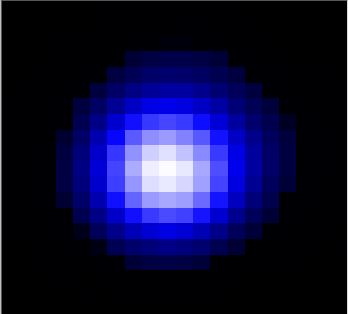
I have used Mathcad to plot an image of a Gaussian beam I obtained from a camera. Obviously the camera has pixels, each with its own pixel value that represents part of the Gaussian beams intensity. When I plot this intensity image in a 3D plot in Mathcad it displays a plot in the same dimensions as the camera image, but the data has been 'smoothed' out and now represents a more ideal Gaussian beam profile (rather than a pixelised one seen on the camera image).
My questions are: How is this smoothing of the camera image done? How representative is this of the actual beam incident on the camera?
I have attached pictures of the camera image and the Mathcad contour plot (from 3D plot). I am unable to provide a data sheet as my workplace prohibits it. All I have done is import the saved data of the camera image and asked Mathcad to display it using a 3D plot. I am new to Mathcad, so understanding how this works will be a great use. Thanks to all who have already replied.
Ethan
Solved! Go to Solution.
Labels:
- Labels:
-
Other
ACCEPTED SOLUTION
Accepted Solutions
Jul 27, 2018
04:33 AM
- Mark as New
- Bookmark
- Subscribe
- Mute
- Subscribe to RSS Feed
- Permalink
- Notify Moderator
Please log in to access translation
Jul 27, 2018
04:33 AM
According to the Help of Mathcad 11:
Contour Plots
Contour plots require a matrix of values, which are linearly interpolated to form level curves. Level curves can represent isotherms, isobars, equipotentials, streamlines, and many other physical phenomena. You can format a contour plot in many ways to control its appearance.
So: No smoothing, just interpolation.
Or: the method of smoothing is interpolation, if you will.
Luc
14 REPLIES 14
Jul 26, 2018
11:17 AM
- Mark as New
- Bookmark
- Subscribe
- Mute
- Subscribe to RSS Feed
- Permalink
- Notify Moderator
Please log in to access translation
Jul 26, 2018
11:17 AM
As far as I can tell Mathcad does not smooth graphs and/or plots, unless you tell it to.
Can you show (pictures, Mathcad sheet files) what your problem is?
Luc
Jul 26, 2018
11:18 AM
- Mark as New
- Bookmark
- Subscribe
- Mute
- Subscribe to RSS Feed
- Permalink
- Notify Moderator
Please log in to access translation
Jul 26, 2018
11:18 AM
Can you provide sample data and worksheet?
If you are using the 3D plot to display simple height data, Mathcad always tries to create a smooth surface - in this case even a surface not necessarily containing your data. Probably thats the smoothing you noticed.
For a 3D plot you usually would have to create a mesh first and feed that mesh to th 3D plot.
There might be better ways to manipulate and display your data in Mathcad 15. Prime is too limited, though.
Jul 26, 2018
12:22 PM
- Mark as New
- Bookmark
- Subscribe
- Mute
- Subscribe to RSS Feed
- Permalink
- Notify Moderator
Please log in to access translation

Jul 26, 2018
12:49 PM
- Mark as New
- Bookmark
- Subscribe
- Mute
- Subscribe to RSS Feed
- Permalink
- Notify Moderator
Please log in to access translation
Jul 26, 2018
12:49 PM
That was what I was talking about when I wrote that Primes capabilities would be too limited. There is no Bar Plot option in Primes 3D (nor is shading or the like).
I was also thinking of inserting the data as picture might be an option, but again Prime does not offer that.
Maybe the OP will reveal which data he is dealing with and which version of the software he is using.
Jul 27, 2018
04:23 AM
- Mark as New
- Bookmark
- Subscribe
- Mute
- Subscribe to RSS Feed
- Permalink
- Notify Moderator
Please log in to access translation
Jul 27, 2018
04:23 AM
Hello Werner,
I am able to use a bar plot in 3D (I am using Mathcad 14 - not prime as I have been instructed not to use that). I am not worried about displaying the data as seen by the camera image; the fact it has smoothed out the data is a good thing to be honest as it makes it easier to discuss the work I am doing.
I just would like to know how Mathcad fits to the data. If its a gaussian fit, how does Mathcad know the data contains a gaussian? If it is a general fit, how reliable is it when it comes to the smoothing of the data?
Thanks for your time, I appreciate it,
Ethan
Jul 27, 2018
05:25 AM
- Mark as New
- Bookmark
- Subscribe
- Mute
- Subscribe to RSS Feed
- Permalink
- Notify Moderator
Please log in to access translation
Jul 27, 2018
05:25 AM
"not prime as I have been instructed not to use that"
You have been well instructed.
Luc
Jul 27, 2018
05:46 AM
- Mark as New
- Bookmark
- Subscribe
- Mute
- Subscribe to RSS Feed
- Permalink
- Notify Moderator
Please log in to access translation
Jul 27, 2018
05:46 AM
Haha you can thank my boss for that. Took a while to get Mathcad 14 and not a prime.
Have a good day,
Ethan
Jul 27, 2018
06:56 AM
- Mark as New
- Bookmark
- Subscribe
- Mute
- Subscribe to RSS Feed
- Permalink
- Notify Moderator
Please log in to access translation
Jul 27, 2018
06:56 AM
It would certainly help if you could provide the data and the worksheet so we see what you are talking about and what kind of data structure you are using.
Could imagine that displaying the data as Mathcad image could be appropriate (depending what your goal is). Mathcad offers a lot of image manipulation tools in its Image Processing extension pack (which should be part of MC14, too).
EDIT: Just notice that the problem seems to be solved.
Jul 27, 2018
07:16 AM
- Mark as New
- Bookmark
- Subscribe
- Mute
- Subscribe to RSS Feed
- Permalink
- Notify Moderator
Please log in to access translation
Jul 27, 2018
07:16 AM
Hi Werner,
Thank you for continuing to help me. But I think I have resolved the problem now; mainly my lack of knowledge on how Mathcad works, and not closely inspecting the data. I am happy with understanding now that Mathcad has a linear interpolation between data points, which so happened to look like a curve when I viewed the data with a lot of data points.
Have a good day,
Ethan
Jul 27, 2018
04:10 AM
- Mark as New
- Bookmark
- Subscribe
- Mute
- Subscribe to RSS Feed
- Permalink
- Notify Moderator
Please log in to access translation
Jul 27, 2018
04:10 AM
Hi Luc,
I am able to create the 3D plot, but I appreciate the help. When I plot the data as a surface plot or a contour plot the data has smoothed itself out to show a Gaussian shape. I am just wondering how Mathcad has converted a plot, similar to the one you showed me, to the one I am getting. Is it just a gaussian fitting function? If so how does it know that the data contains a gaussian? Or is there an alternate fitting function Mathcad uses to smooth the data.
(By smooth, just in case I am confusing people, for example what I mean: imagine a histogram of a normal distribution. Then image how one can convert this into a gaussian curve.).
Thank you for taking the time to reply,
Ethan
Jul 27, 2018
04:23 AM
- Mark as New
- Bookmark
- Subscribe
- Mute
- Subscribe to RSS Feed
- Permalink
- Notify Moderator
Please log in to access translation
Jul 27, 2018
04:23 AM
Are you using (real) mathacd (11...15) or Prime?
Luc
Jul 27, 2018
04:36 AM
- Mark as New
- Bookmark
- Subscribe
- Mute
- Subscribe to RSS Feed
- Permalink
- Notify Moderator
Please log in to access translation
Jul 27, 2018
04:36 AM
Hi Luc,
I am using Mathcad 14. I have been looking at the data as a surface plot again and comparing it to the data points plot. I now think that Mathcad is simply creating linear fits between each data point, and with the amount of data points I have it just looks smoothed out to me. So this should be representative of the actual beam I have incident on the camera.
Thank you for your time once again,
Ethan
Jul 27, 2018
04:33 AM
- Mark as New
- Bookmark
- Subscribe
- Mute
- Subscribe to RSS Feed
- Permalink
- Notify Moderator
Please log in to access translation
Jul 27, 2018
04:33 AM
According to the Help of Mathcad 11:
Contour Plots
Contour plots require a matrix of values, which are linearly interpolated to form level curves. Level curves can represent isotherms, isobars, equipotentials, streamlines, and many other physical phenomena. You can format a contour plot in many ways to control its appearance.
So: No smoothing, just interpolation.
Or: the method of smoothing is interpolation, if you will.
Luc
Jul 27, 2018
04:38 AM
- Mark as New
- Bookmark
- Subscribe
- Mute
- Subscribe to RSS Feed
- Permalink
- Notify Moderator
Please log in to access translation
Jul 27, 2018
04:38 AM
Hi again,
Just saw your other messages. Haha yeah you must be right as I have just seen it. Silly of me not to focus in on a smaller area to see what was actually happening.
Best wishes,
Ethan


