Community Tip - Want the oppurtunity to discuss enhancements to PTC products? Join a working group! X
- Subscribe to RSS Feed
- Mark Topic as New
- Mark Topic as Read
- Float this Topic for Current User
- Bookmark
- Subscribe
- Mute
- Printer Friendly Page
AUTOMATED (PROGRAMMED) CALCULATIONS
- Mark as New
- Bookmark
- Subscribe
- Mute
- Subscribe to RSS Feed
- Permalink
- Notify Moderator
AUTOMATED (PROGRAMMED) CALCULATIONS
Hello everybody,
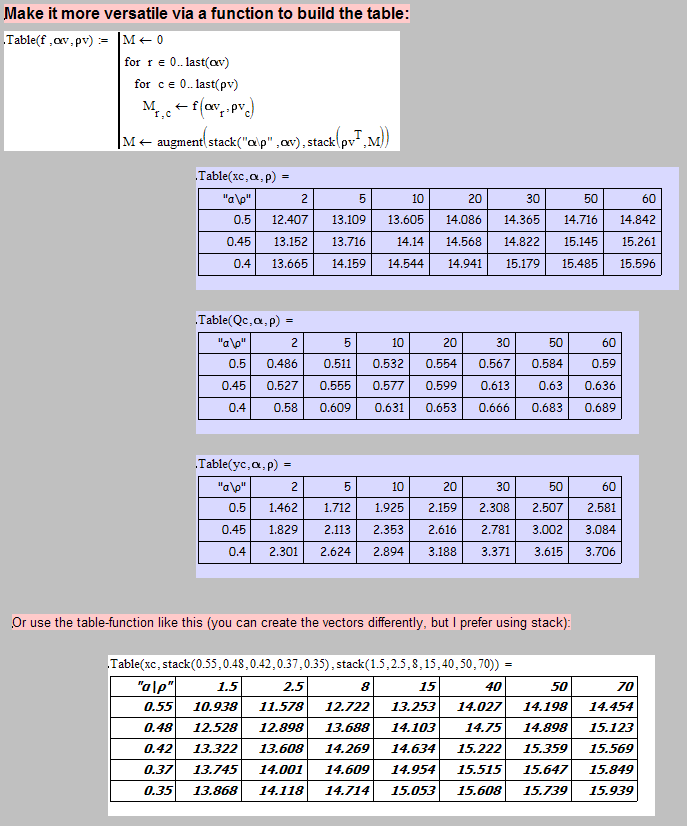
I have attached a MathCad 15 worksheet. I would like to make tables of the following parameters for 3 values of alpha and for different rhos.
rho values: 2, 5, 10, 20, 30, 50 and 60
x1c, x2c and x3c corresponding to alpha=0.50, 0.45 and 0.40 respectively.
Q1c, Q2c and Q3c - same thing.
y1c, y2c and y3c - same thing.
Please go to the "Xc, Qc and Yc Section" on the worksheet.
Also, I would like to make some graphs of these parameters.
Thank you so much for the time and help.
Anousheh
PS final results as an array would be OK. I guess, it can then be exported to excel. OR, can MactCad produce tables?
Solved! Go to Solution.
- Labels:
-
Other
Accepted Solutions
- Mark as New
- Bookmark
- Subscribe
- Mute
- Subscribe to RSS Feed
- Permalink
- Notify Moderator
Anousheh Rouzbehani schrieb:
Hi Werner,
My original ODE has 2alpha in the nominator. Yours is alpha. I changed yours to 2alpha and some parts of the worksheet became RED! Could you please tell me why?
Worksheet is beautiful.
Thanks,
Anousheh
My ODE function is identical to your. You may notice the i have multiplied the expression in the brackets with that 2. So there you have 2*M and no 1/2 anymore. This was done as I don't like my expression to go over to the right out of the sheet. So you should not change it.
The reason for part of the worksheet going red could be that the root function, which calculates the xc values, does not find a solution. This part of the sheet is a little bit sensible and this applies to the values and combinations of alpha and rho, too. I have changed the call to root by not providing a guess value but by providing an interval (x0 to xe, 10 to 20 in the sheet) to search for a solution. The function values of S at those interval limits must have different signs, otherwise root fails. I had (shortly) experimented to generalize your version with the guess value. A guess of x:=14 will work with the values in the sheet, but not with all combinations of alpha and rho, too. You know your functions better and have to decide which version of root to use. My first idea was to make the center of the interval 0.5*(x.e+x.0) the guess, but 15 failded with the x1 in the sheet. So I decided to go for the interval. Another appraoch would be to use a parameterized solve block with find.
- Mark as New
- Bookmark
- Subscribe
- Mute
- Subscribe to RSS Feed
- Permalink
- Notify Moderator
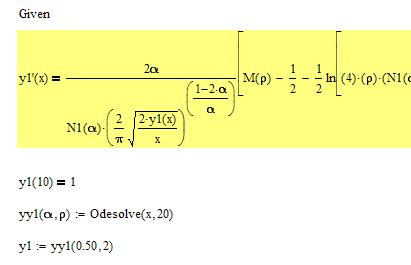
Most of your function definitions use constant values for alpha and rho which are set differently throughout your worksheet. To achieve what you want you would have to rewrite those function to accommodate the additional parameters rho and alpha and delete all assignments for alpha and rho.
Instead of ff(x):=..... you would write ff_(x,alpha,rho):=.... and then you may define ff(x):=ff_(x,0.5,10), as these are the actual values for alpha and rho at that part of your worksheet and you obviously want your function ff to be defined with those constant values.
The solve blocks with Odesolve may be a bit trickier, you could do it that way (the function name y1 inside the solve block does not matter, it could be anything):

- Mark as New
- Bookmark
- Subscribe
- Mute
- Subscribe to RSS Feed
- Permalink
- Notify Moderator
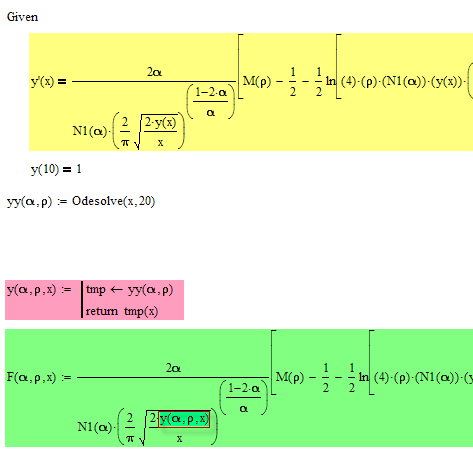
One additional thought: Making the result of Odesolve, y, a function af alpha, rho and x as you need, is even a bit trickier, I found. You can do it as shown below, but evaluation is quite slow. Anybody having a better idea?

- Mark as New
- Bookmark
- Subscribe
- Mute
- Subscribe to RSS Feed
- Permalink
- Notify Moderator
Hi,
Thank you Werner. I am trying what you have suggested. Let me see if I can get the results I need.
Regards,
Anousheh
- Mark as New
- Bookmark
- Subscribe
- Mute
- Subscribe to RSS Feed
- Permalink
- Notify Moderator
Anousheh Rouzbehani schrieb:
Hi,
Thank you Werner. I am trying what you have suggested. Let me see if I can get the results I need.
Regards,
Anousheh
I think the attached sheet should fulfill your needs.
I deleted the sections above "Xc, Qc and Yc Section" and have not yet integrated Alans suggestion.
Werner

- Mark as New
- Bookmark
- Subscribe
- Mute
- Subscribe to RSS Feed
- Permalink
- Notify Moderator
Hi again Werner,
This is more than I could ask. Thank you so much for your help and time.
I really appreciate this.
I have not opened the program yet. I read your post. Looks beautiful to me.
I shall get back to you if there is anything that needs more clarification from you.
Thanks again,
Anousheh
- Mark as New
- Bookmark
- Subscribe
- Mute
- Subscribe to RSS Feed
- Permalink
- Notify Moderator
You are welcome.
In the attached I only changed the last function a bit so you can create tables without headers/labels, too. In case you have to use the tables in a way the labels would disturb.
You will notice that the evaluation of the functions is very slow now. This is described in the sheet and the reason is the way I had to build the function y which is derived from the ODE solution. Everytime this function or another one which is derived from y is called, the solveblock is evaluated again. So if you graph one of this functions this happens for every value of x (in yout case 100 times).
I don't know of another way to keep alpha and rho variable.
- Mark as New
- Bookmark
- Subscribe
- Mute
- Subscribe to RSS Feed
- Permalink
- Notify Moderator
Hello,
Thank you Werner. Really great stuff.
Like always, greatly appreciate this.
Anousheh
- Mark as New
- Bookmark
- Subscribe
- Mute
- Subscribe to RSS Feed
- Permalink
- Notify Moderator
Hi Werner,
My original ODE has 2alpha in the nominator. Yours is alpha. I changed yours to 2alpha and some parts of the worksheet became RED! Could you please tell me why?
Worksheet is beautiful.
Thanks,
Anousheh
- Mark as New
- Bookmark
- Subscribe
- Mute
- Subscribe to RSS Feed
- Permalink
- Notify Moderator
Anousheh Rouzbehani schrieb:
Hi Werner,
My original ODE has 2alpha in the nominator. Yours is alpha. I changed yours to 2alpha and some parts of the worksheet became RED! Could you please tell me why?
Worksheet is beautiful.
Thanks,
Anousheh
My ODE function is identical to your. You may notice the i have multiplied the expression in the brackets with that 2. So there you have 2*M and no 1/2 anymore. This was done as I don't like my expression to go over to the right out of the sheet. So you should not change it.
The reason for part of the worksheet going red could be that the root function, which calculates the xc values, does not find a solution. This part of the sheet is a little bit sensible and this applies to the values and combinations of alpha and rho, too. I have changed the call to root by not providing a guess value but by providing an interval (x0 to xe, 10 to 20 in the sheet) to search for a solution. The function values of S at those interval limits must have different signs, otherwise root fails. I had (shortly) experimented to generalize your version with the guess value. A guess of x:=14 will work with the values in the sheet, but not with all combinations of alpha and rho, too. You know your functions better and have to decide which version of root to use. My first idea was to make the center of the interval 0.5*(x.e+x.0) the guess, but 15 failded with the x1 in the sheet. So I decided to go for the interval. Another appraoch would be to use a parameterized solve block with find.
- Mark as New
- Bookmark
- Subscribe
- Mute
- Subscribe to RSS Feed
- Permalink
- Notify Moderator
Hello Werner,
Thank you so much.
This is great!
Anousheh
- Mark as New
- Bookmark
- Subscribe
- Mute
- Subscribe to RSS Feed
- Permalink
- Notify Moderator
Anousheh Rouzbehani schrieb:
Hello Werner,
Thank you so much.
This is great!
Anousheh
Glad you are up and running, again.
Hope you could finish your work on this, too http://communities.ptc.com/message/197734#197734
Werner
- Mark as New
- Bookmark
- Subscribe
- Mute
- Subscribe to RSS Feed
- Permalink
- Notify Moderator
Hello Werner,
I had to jump into the new section (automated tables), so I have to go back, later on, to the previous topic (substitutions) to see if I can manage to get what I want.
Thanks for your help.
Regards,
Anousheh
- Mark as New
- Bookmark
- Subscribe
- Mute
- Subscribe to RSS Feed
- Permalink
- Notify Moderator
Hello Werner,
Thanks again for all your time and help.
Please see the attached worksheet. This is the one you did for me earlier. I have modified ODE and some other expressions. The range for alpha is the same, i.e. 0.40, 0.45 and 0.50
The range for rho, I have changed to new one.
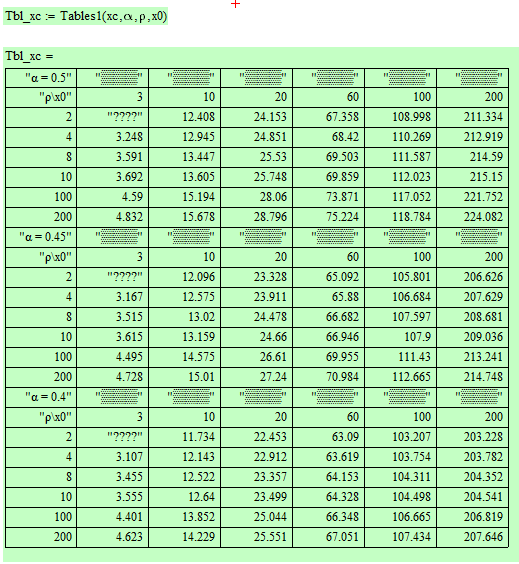
I have this time the range for x0 to be included as: x0=3, 10, 20, 60, 100 and 200
Would you please modify the automated section at the bottom of the worksheet to include x0 in the tables?
Now, I have to go to the top of the worksheet and change x0 manually to get the results.
As it can be seen, for x0=100, there are RED fields everywhere!
Thanks again for your help,
Anousheh
- Mark as New
- Bookmark
- Subscribe
- Mute
- Subscribe to RSS Feed
- Permalink
- Notify Moderator
The error encountered (after a long while waiting for the sheet to calculate - first thing I did was disabling the graphs 😉 are thrown by xc(0.4,2).
This function trys to calculate the roots of S in the range x.0 to x.e, but for that constallation of variable values S has no root in this range - it looks like it doesn have a root at all. I dont know how would like to deal with that situation!??
As for the tables at the end - its easy to create a 2D-table if you have two variables (alpha and rho) to vary. No you want to add a third one (x0). The tables will still be 2-dimensional, so how do you want the tables to look like? Obviously you can choose 2 variables you see in the table and create a table for each value of the third one.
If we take x0 aas the third one, this would make up for a total of 18 3x6 tables as we have it now. If we choose to make tables which show x0 and rho, we wouldend up with only 9 6x6 tables as there a only 3 values for alpha.
But first you would have to decide what to do if S has no root in the choosen interval or no root at all.
- Mark as New
- Bookmark
- Subscribe
- Mute
- Subscribe to RSS Feed
- Permalink
- Notify Moderator
Hello Werner,
Thank you so much.
I changed x.0 to x0 and it seems that the program works now.
If I have any issue, I shall get back to you again,
Thanks,
Anousheh
- Mark as New
- Bookmark
- Subscribe
- Mute
- Subscribe to RSS Feed
- Permalink
- Notify Moderator
Anousheh Rouzbehani schrieb:
Hello Werner,
Thank you so much.
I changed x.0 to x0 and it seems that the program works now.
If I have any issue, I shall get back to you again,
Thanks,
Anousheh
Now I am totally confused!
Where did you do that change? Does it make sense???
x0 is a variable you introduced in the new sheet and you want it to make it into the tables at the end.
x.0 and y.0 were introduced by me and reflect the initial condition of your ODE - you had hard coded y(10)=1 in your first sheet, I think.
As your graphs went from 10 tp 200 in your first sheet I defined x.e:=200 and declared a range variable from x.0 to x.e for plotting the graph as it seemed to me that this is the range of interest for you. I also used x.0 and x.e as interval limits for the root command.
If your newly introduced x0 should be the startvalue for your initial condition you would have to change it in more places and you would have to provide a suitable value for the endvlaue x.e which at the time is 200 (which does not make sense for x0=200).
Are you sure that x.0 should be x0?
- Mark as New
- Bookmark
- Subscribe
- Mute
- Subscribe to RSS Feed
- Permalink
- Notify Moderator
Hello Werner,
Thanks again,
I changed x.e to 300 to take care of my x0=200. It returned a good value.
For the time being, I am not incorporating x0 into the table - as I have no time, (there is a deadline for my submission). Just change x0 manually each time for new results.
I want y(x0)=1 in all calculations.
So the program is OK for now. We modify it later on.
Thanks again,
Anousheh
- Mark as New
- Bookmark
- Subscribe
- Mute
- Subscribe to RSS Feed
- Permalink
- Notify Moderator
Anousheh Rouzbehani schrieb:
For the time being, I am not incorporating x0 into the table - as I have no time, (there is a deadline for my submission). Just change x0 manually each time for new results.
Thought you are in need for that from your recent posts so I gave it a try.
See the attached - you may modify to fit your needs
BTW - root stills throws an error for rho=2 and x0=3, but this error is trapped now and shown as "???" in the table.

- Mark as New
- Bookmark
- Subscribe
- Mute
- Subscribe to RSS Feed
- Permalink
- Notify Moderator
Hello Werner,
Thank you very much for all your time and help. Really appreciate this.
Werner Exinger wrote:
Thought you are in need for that from your recent posts so I gave it a try.
See the attached - you may modify to fit your needs
BTW - root stills throws an error for rho=2 and x0=3, but this error is trapped now and shown as "???" in the table.
I forgot to tell you that, the crack is "unstable" at x0=3 for rho=2. So, the program is right. I can replace "???" with "unstable".
I can still see REDS in the worksheet, but beautiful TABLES are generated at the bottom.
I shall go through the entire worksheet very carefully to see what has been done.
Thanks again and all the best,
Anousheh
- Mark as New
- Bookmark
- Subscribe
- Mute
- Subscribe to RSS Feed
- Permalink
- Notify Moderator
I can still see REDS in the worksheet,
This is because I didn't change the evaluation of the sample values x1c .. y3c which seem to be obselete now anyway. If not you would have to specify the new parameter x0.
Also the graphs are disabled and would not work if you enable them because of the missing parametr x0 and because I deleted the function definitions for Fiapp, Fi and Qi (i=1,2,3). You would have to replace them as shown in the first graph. Plots take a very long time to evaluate due to reason explained earlier.
Find attached a variant with differently arranged tables which I guess could be more useful.
- Mark as New
- Bookmark
- Subscribe
- Mute
- Subscribe to RSS Feed
- Permalink
- Notify Moderator
Hello Werner,
Thank you so much again. Really nice program with beautiful TABLES.
Werner Exinger wrote:
This is because I didn't change the evaluation of the sample values x1c .. y3c which seem to be obsolete now anyway. If not you would have to specify the new parameter x0.
Could you tell me where do I define x0?
Thanks,
Anousheh
- Mark as New
- Bookmark
- Subscribe
- Mute
- Subscribe to RSS Feed
- Permalink
- Notify Moderator
Could you tell me where do I define x0?
Thanks,
Anousheh
All functions which depends on x0 have x0 as (in our case, last but one) parameter. Otherwise you would not be able to vary x0.
In the new sheet I already have put some arbitrary values (60,10,100) for x0 at the definitions of x1c to y3c. Change them to what seems appriate to you. Changing them all to 10 would give you the results of the former sheets.
As for the plots - instead of "F2app(x)" you would write "Fapp(0.50, 2, 10, x)" for instance to get the same graph as in the original sheet. Change the value 10 for whatever you want x0 to be.
Keep in mind the the evaluation of the plots its very timeconsuming as the calculation for every single function value would have to evaluate the whole solve block again. This could only be avoided for the plots of y but not for F, Fapp and Q, I think. Thats the reason these plots are deactivated in my sheet as they would have taken up too much time evaluating while I was playing around with the tables.
- Mark as New
- Bookmark
- Subscribe
- Mute
- Subscribe to RSS Feed
- Permalink
- Notify Moderator
Hello Werner,
I do not know what to say!
I can only say THANK you for your great help.
I wish I could appreciate this in a way more appropriate.
Let me wish you and your family a very healthy, peaceful and prosperous life.
Thank you again,
Anousheh
PS of course, we shall be in touch.
- Mark as New
- Bookmark
- Subscribe
- Mute
- Subscribe to RSS Feed
- Permalink
- Notify Moderator
OK, a last one 😉
I couldn't stand it that those graphs are evaluated soooooo sloooooow because for every single point plotted the whole solve block would have been called again.
I found a solution which draws the graphs really quick (only one call to the solve block for the whole graph). It has a drawback, though, as you would have to write a new function just for plotting in which you have to define all of the function like F, Fapp and Q again. This is rather errorprone but I couldn't think of another solution.
Don't think that the table construction could be speeded up in a similar way and for now I'll keep my fingers off 😉
Good luck with your publication and in learning AI
Werner
PS: Forget about the problem with the functions defined twice - have found a solution. See attached
- Mark as New
- Bookmark
- Subscribe
- Mute
- Subscribe to RSS Feed
- Permalink
- Notify Moderator
Werner Exinger schrieb:
OK, a last one 😉
Hmm, that was a lie.
The attached is last one 😉
Now even the tables calcuate much quicker.
Please check the values and the figures to look that they have not changed and are still what they are supposed to be.
- Mark as New
- Bookmark
- Subscribe
- Mute
- Subscribe to RSS Feed
- Permalink
- Notify Moderator
Hi,
Thanks. Please ignore my last post.
The worksheet works perfect. I double checked the figures.
Thanks again.
Anousheh
- Mark as New
- Bookmark
- Subscribe
- Mute
- Subscribe to RSS Feed
- Permalink
- Notify Moderator
Thanks. Please ignore my last post.
The worksheet works perfect. I double checked the figures.
Glad to hear so.
Don't know what precision you are striving for, but it could help to increase the intervals at Odesolve (up to 10^6 should be possible with bearable calculation time) and decrease system varíable TOL (10^-6 or less). It depends on the ODE solver method you chose if TOL has an effect, Adams, BDF and Radau are not effected, rkfixed, RkAdapt and some others are.
- Mark as New
- Bookmark
- Subscribe
- Mute
- Subscribe to RSS Feed
- Permalink
- Notify Moderator
Hello Werner,
Thanks for the information.
For the time being, what you did for me is more than I expected.
Thanks again and all the best,
Anousheh
- Mark as New
- Bookmark
- Subscribe
- Mute
- Subscribe to RSS Feed
- Permalink
- Notify Moderator
Anousheh Rouzbehani schrieb:
Hello Werner,
Thanks for the information.
For the time being, what you did for me is more than I expected.
Thanks again and all the best,
Anousheh
No problem. I just wanted to point it out to you. Since the first version of the sheet the interval at which Odesolve has to solve was exended from 10-20 to 3-300. Thats approx. thirty times bigger so I thought it would be just fair to spend Odesolve at least the same multiple of intervals (30000 instead of the standard 1000). I assume that the values farther away from x0 are more kind of phantasy values than.
The values in the table should not be affected that much. I just tried setting TOL to 10^-8 and using 50000 intervals at Odesolve and in the table values most of the third decimal place changed. So if you are happy with a precision of two decimal places in the tables I guess you must not change anything.


