
Turn on suggestions
Auto-suggest helps you quickly narrow down your search results by suggesting possible matches as you type.
Showing results for
Please log in to access translation
Turn on suggestions
Auto-suggest helps you quickly narrow down your search results by suggesting possible matches as you type.
Showing results for
Community Tip - Learn all about PTC Community Badges. Engage with PTC and see how many you can earn! X
Translate the entire conversation x
Please log in to access translation
Options
- Subscribe to RSS Feed
- Mark Topic as New
- Mark Topic as Read
- Float this Topic for Current User
- Bookmark
- Subscribe
- Mute
- Printer Friendly Page
Add/Remove More plot lines automatically from a vector plot
Jan 10, 2014
06:19 PM
- Mark as New
- Bookmark
- Subscribe
- Mute
- Subscribe to RSS Feed
- Permalink
- Notify Moderator
Please log in to access translation
Jan 10, 2014
06:19 PM
Add/Remove More plot lines automatically from a vector plot
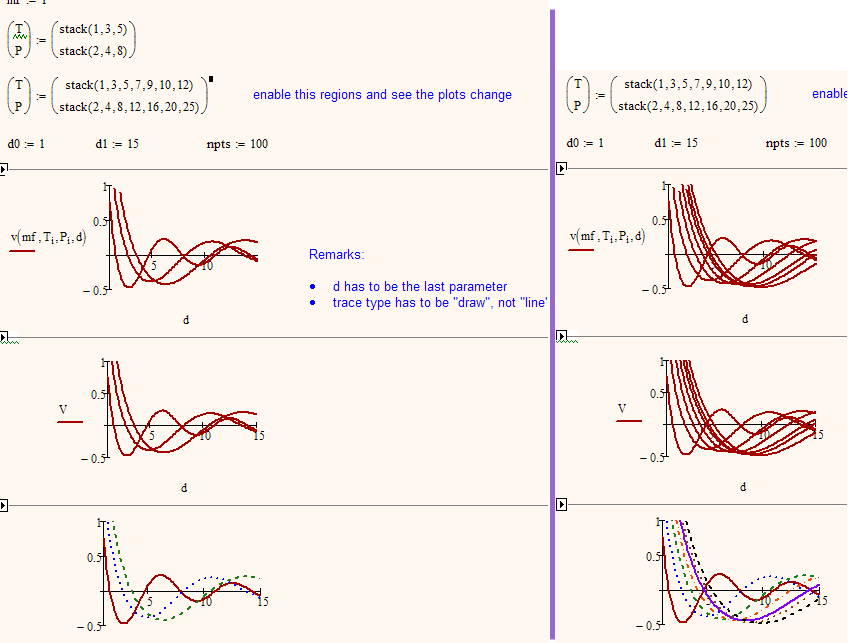
I am plotting the velocity in a line verse the diameter of the line. I have a vector of temperatures and pressures. I am wondering if it is possible to automatically add more plot lines to a 2D plot if I add another entry in the temperature and pressure vectors. The velocity is currently a function of the mass flow, diameter, temperature and pressure.
Solved! Go to Solution.
Labels:
- Labels:
-
Other
ACCEPTED SOLUTION
Accepted Solutions
Jan 14, 2014
01:31 PM
- Mark as New
- Bookmark
- Subscribe
- Mute
- Subscribe to RSS Feed
- Permalink
- Notify Moderator
Please log in to access translation
Jan 14, 2014
01:31 PM
Here is your file with a working waterfall plot - you may take the pdf of my MC15 file as a guide.
The third method should work in Prime as well, but will not look that good as prime will not collapse the height of the plot when not edited and it will also show an error for the unused plots (which are all "constant" NaN).

7 REPLIES 7
Jan 10, 2014
11:01 PM
- Mark as New
- Bookmark
- Subscribe
- Mute
- Subscribe to RSS Feed
- Permalink
- Notify Moderator
Please log in to access translation
Jan 10, 2014
11:01 PM
May be so.
I create one line with the view of a set of lines:
On Mathcad server:
Jan 11, 2014
10:57 AM
- Mark as New
- Bookmark
- Subscribe
- Mute
- Subscribe to RSS Feed
- Permalink
- Notify Moderator
Please log in to access translation
Jan 11, 2014
10:57 AM
First you should state which version of Mathcad the questions is for. Not every method to plot a family of curves will work in Prime.
Then it sure would help if you post your worksheet showing the equations and vectors you would like to apply.
You may look up "waterfall plot" in the help and there is also a quicksheet dealing with the substect if I remember correctly.
Furthermore the subsject was discussed here a couple of time so you may search for posting with "waterfall" and/or "family of curves". Maybe this thread could be of interest http://communities.ptc.com/message/209873#209873
Jan 14, 2014
09:54 AM
- Mark as New
- Bookmark
- Subscribe
- Mute
- Subscribe to RSS Feed
- Permalink
- Notify Moderator
Please log in to access translation
Jan 14, 2014
09:54 AM
Here is my current worksheet. It is mathcad 3.0 Prime.
Jan 13, 2014
08:42 AM
- Mark as New
- Bookmark
- Subscribe
- Mute
- Subscribe to RSS Feed
- Permalink
- Notify Moderator
Please log in to access translation
Jan 13, 2014
08:42 AM
Could it be you are searching something like the attached?
Jan 14, 2014
10:05 AM
- Mark as New
- Bookmark
- Subscribe
- Mute
- Subscribe to RSS Feed
- Permalink
- Notify Moderator
Please log in to access translation
Jan 14, 2014
10:05 AM
Here is my attempt at doing the waterfall graph. I'd be interested to know how to also do the line change graph if any of that is possible in Prime 3.0.
Jan 14, 2014
01:31 PM
- Mark as New
- Bookmark
- Subscribe
- Mute
- Subscribe to RSS Feed
- Permalink
- Notify Moderator
Please log in to access translation
Jan 14, 2014
01:31 PM
Here is your file with a working waterfall plot - you may take the pdf of my MC15 file as a guide.
The third method should work in Prime as well, but will not look that good as prime will not collapse the height of the plot when not edited and it will also show an error for the unused plots (which are all "constant" NaN).
Jan 15, 2014
12:15 AM
- Mark as New
- Bookmark
- Subscribe
- Mute
- Subscribe to RSS Feed
- Permalink
- Notify Moderator
Please log in to access translation
Jan 15, 2014
12:15 AM
Plot of the set of line on thr Mathcad server.
http://twtmas.mpei.ac.ru/mas/Worksheets/2D_Plot_y_x_a.mcd
You can download the sheet on this site.


