Community Tip - Learn all about the Community Ranking System, a fun gamification element of the PTC Community. X
- Subscribe to RSS Feed
- Mark Topic as New
- Mark Topic as Read
- Float this Topic for Current User
- Bookmark
- Subscribe
- Mute
- Printer Friendly Page
Capacitor model unit issue
- Mark as New
- Bookmark
- Subscribe
- Mute
- Subscribe to RSS Feed
- Permalink
- Notify Moderator
Capacitor model unit issue
Hi,
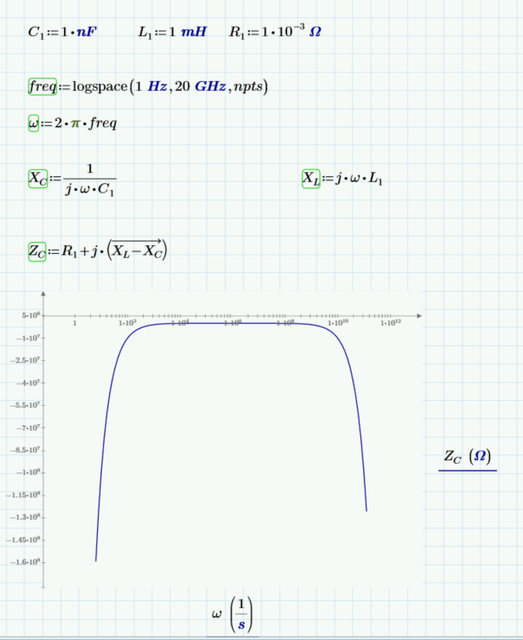
I am trying to model a capacitor based of the input values for L and R and plot the results.
If I plotting unit-less then the calculation is OK, others I get wired values for Xc and Xl.
Can somebody can point me where is the problem?
Solved! Go to Solution.
- Labels:
-
Electrical_Engineering
Accepted Solutions
- Mark as New
- Bookmark
- Subscribe
- Mute
- Subscribe to RSS Feed
- Permalink
- Notify Moderator
- Mark as New
- Bookmark
- Subscribe
- Mute
- Subscribe to RSS Feed
- Permalink
- Notify Moderator
- Mark as New
- Bookmark
- Subscribe
- Mute
- Subscribe to RSS Feed
- Permalink
- Notify Moderator
@Bogdan_d wrote:
Hi,
I am trying to model a capacitor based of the input values for L and R and plot the results.
If I plotting unit-less then the calculation is OK, others I get wired values for Xc and Xl.
Can somebody can point me where is the problem?
Yes 🙂
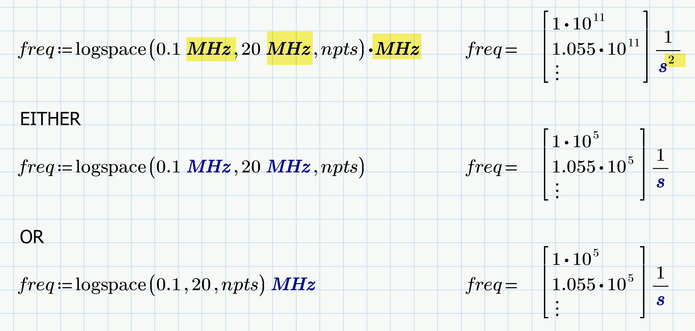
You assign the unit MHz TWICE! So "freq" ends up with unit Hz^2 or 1/s^2
You have two options to assign the unit just once, either in the "logspace" function or as a factor after it, but not both!
- Mark as New
- Bookmark
- Subscribe
- Mute
- Subscribe to RSS Feed
- Permalink
- Notify Moderator
- Mark as New
- Bookmark
- Subscribe
- Mute
- Subscribe to RSS Feed
- Permalink
- Notify Moderator
Hi,
Thank you to all for your quick answer.
I am still not able to plot the values. It is drive me crazy. For such a simple thing, I still cannot find error.
- Mark as New
- Bookmark
- Subscribe
- Mute
- Subscribe to RSS Feed
- Permalink
- Notify Moderator
- Mark as New
- Bookmark
- Subscribe
- Mute
- Subscribe to RSS Feed
- Permalink
- Notify Moderator
Hi,
I understood your answer, now I am struggle with unitless values in the plot representation.
It is curious that after I downloaded your file and open as it is is working, if I delete and try to apply the same what you did I start to have again issues.
For sure I am doing something wrong and cannot catch the point. I have look on the post here with unitless problem, but still I cannot fix it. I do miss something here.
- Mark as New
- Bookmark
- Subscribe
- Mute
- Subscribe to RSS Feed
- Permalink
- Notify Moderator
- Mark as New
- Bookmark
- Subscribe
- Mute
- Subscribe to RSS Feed
- Permalink
- Notify Moderator
Hello,
I am coming back with this topic. I have some time to play with some real values for the capacitor.
Unfortunately it seems that by plotting the value using logarithm axes on the plot the frequency is shifted by x10 times.
As it can be seen in the supplier of the capacitor the value from his chart is matching the values calculated using the same formulas as used in MathCAD, but in excel and there are matching.
Here on the MathCAD are multiplied by almost 10. Please advice here.
Either is an issue of the plotting, or using logspace and then changing the axes to log the result is log x log or...
Thank you.
- Mark as New
- Bookmark
- Subscribe
- Mute
- Subscribe to RSS Feed
- Permalink
- Notify Moderator
@Bogdan_d wrote:
Hello,
I am coming back with this topic. I have some time to play with some real values for the capacitor.
Unfortunately it seems that by plotting the value using logarithm axes on the plot the frequency is shifted by x10 times.
No, its not 10 times, its 2*pi = 6.28 times 🙂
The suppliers plot shows freuency (freq) at the absicissa, but your plot shows circular freqency (omega).
Prime 10 sheet attached
BTW, an additional question after that long time dealing with a different problem sure would have deserved opening a new thread for it. Doing so also has the benefit of possibly getting more attention as opposed to an older already closed thread.
EDIT: Added log-grid
- Mark as New
- Bookmark
- Subscribe
- Mute
- Subscribe to RSS Feed
- Permalink
- Notify Moderator
Many thanks for pointing this, it works 🙂
- Mark as New
- Bookmark
- Subscribe
- Mute
- Subscribe to RSS Feed
- Permalink
- Notify Moderator
You are plotting, but the |Xc(w)| takes the norm of the vector, which is a single value. You can see the point at w=0, |Xc(w)|=0.5
If you want the result to be a vector, you have to vectorise the expression, so make it:
Then you get:
And on a log/log plot you get the (probably) expected:
Success!
Luc
- Mark as New
- Bookmark
- Subscribe
- Mute
- Subscribe to RSS Feed
- Permalink
- Notify Moderator
Hi,
Yes, for a matrix with vectors you have to vectorize the multiplication of them to have them one by one multiplied.
- Mark as New
- Bookmark
- Subscribe
- Mute
- Subscribe to RSS Feed
- Permalink
- Notify Moderator
This has little to do with 'multiplication', it's rather about an operation, namely |x|, that takes the absolute value if x is a scalar, but it takes the norm when x is a vector. If you want instead that the absolute value of each of the vector elements is taken, you have to apply vectorisation.
You can also do what ttokoro did, and that is index your vectors. Note that he plotted |Xc(w.i)| versus w.i, in which case the argument to the absolute value is again a scalar, and no vectorisation is needed. But this requires that you define the index i.
Success!
Luc
- Mark as New
- Bookmark
- Subscribe
- Mute
- Subscribe to RSS Feed
- Permalink
- Notify Moderator
Hi,
Thank you to all for your help.
The issue was that in the end I didn't catch under the vector also the modulo.


