- Subscribe to RSS Feed
- Mark Topic as New
- Mark Topic as Read
- Float this Topic for Current User
- Bookmark
- Subscribe
- Mute
- Printer Friendly Page
Discrepancy in Bode Plot: Phase - Frequency Plot -> Mathcad vs Matlab
- Mark as New
- Bookmark
- Subscribe
- Mute
- Subscribe to RSS Feed
- Permalink
- Notify Moderator
Discrepancy in Bode Plot: Phase - Frequency Plot -> Mathcad vs Matlab
Hello Dear Friends,
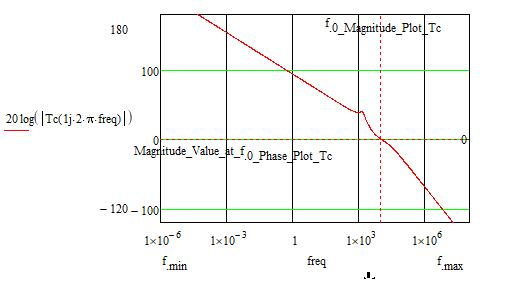
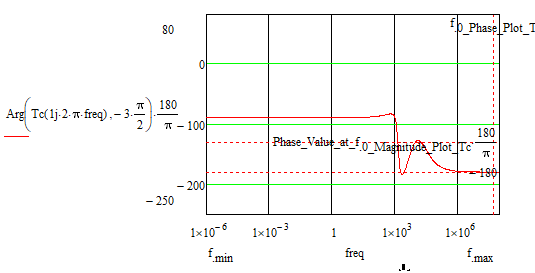
How can it be solved that the phase - frequency graph of the bode diagram in Mathcad looks like the phase - frequency graph of the bode diagram in Matlab?
Calculations and graphs were made in Mathcad 15.
Attached is the Mathcad 15 file with the details.
Thank you.
Best regards.
Solved! Go to Solution.
- Labels:
-
Electrical_Engineering
-
Mathcad Usage
- Mark as New
- Bookmark
- Subscribe
- Mute
- Subscribe to RSS Feed
- Permalink
- Notify Moderator
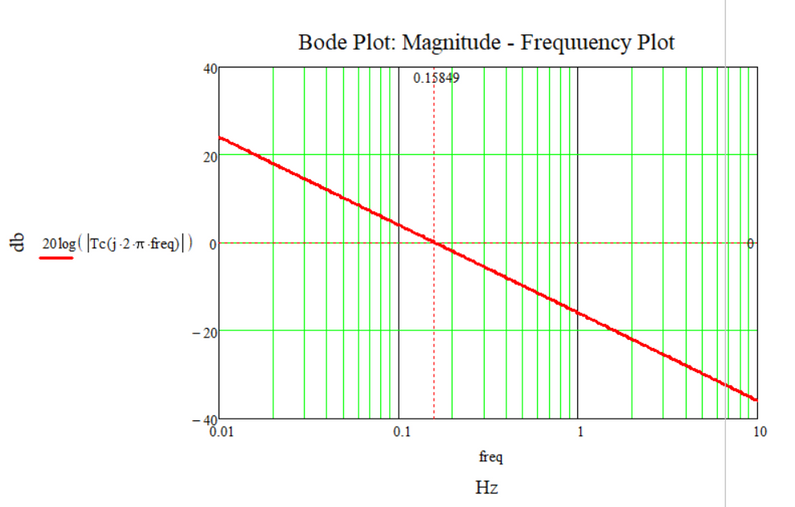
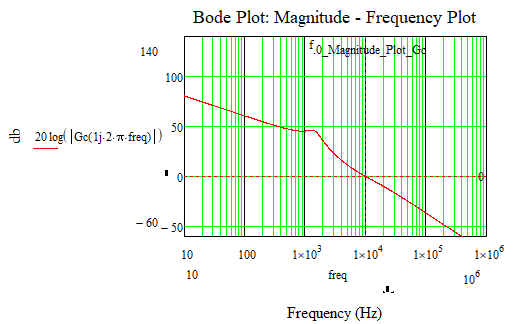
I see in the magnitude - frequency graph of the bode diagram that the figure (straight line) intersects the 0db axis, and therefore there should be a certain frequency value for this.
At least at first glance, I don't see a problem with that.
- Mark as New
- Bookmark
- Subscribe
- Mute
- Subscribe to RSS Feed
- Permalink
- Notify Moderator
@Cornel wrote:
I see in the magnitude - frequency graph of the bode diagram that the figure (straight line) intersects the 0db axis, and therefore there should be a certain frequency value for this.
Sure!
I also hope that you see that the frequency is about 1.6*10^-1 Hz!
So why are you looking for it in the range from 10 to 10^6
or in the range from 10^2 to 10^6
or in the range from 10^1 to 10^7
You should fully understand the meaning of the arguments of the functions you were given and also have a good understanding of how they work. Otherwise you may ask here if something is still unclear.
- Mark as New
- Bookmark
- Subscribe
- Mute
- Subscribe to RSS Feed
- Permalink
- Notify Moderator
Ok.
Good!
Excellent!
Works now :).
Thank you very much for your explanation/observation.
- Mark as New
- Bookmark
- Subscribe
- Mute
- Subscribe to RSS Feed
- Permalink
- Notify Moderator
@Werner_E, @LucMeekes, @Fred_Kohlhepp
[This is the thank you message 🙂]
I wanted to add this message of thanks because your ideas and suggestions (which materialized through Mathcad files or algorithms/programs to solve the problem) related to the problems I exposed in this topic helped me very, very, very much.
But not only that but also the fact that I received an answer at any (later) time, which is not such a simple thing from enough points of view (time, knowledge, etc.), especially when you try to solve a problem and feel that you would like a second or a third opinion from other people.
I would have honored you with a beer, something if you were with me in my city/country.
But anyway, even in these times (with the pandemic of course), it's not so trivial to be realized.
Therefore, what I can convey to you is a kindly thank you.
Thank you very much.
Best regards.
- Mark as New
- Bookmark
- Subscribe
- Mute
- Subscribe to RSS Feed
- Permalink
- Notify Moderator
You are welcome!
- Mark as New
- Bookmark
- Subscribe
- Mute
- Subscribe to RSS Feed
- Permalink
- Notify Moderator
@Werner_E, @LucMeekes, @Fred_Kohlhepp
I don't understand why the following thing happens:
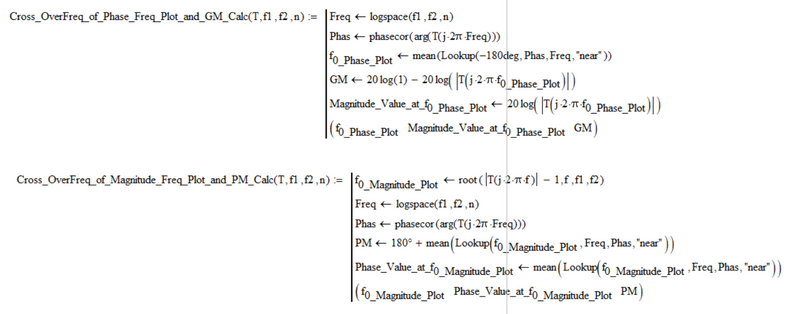
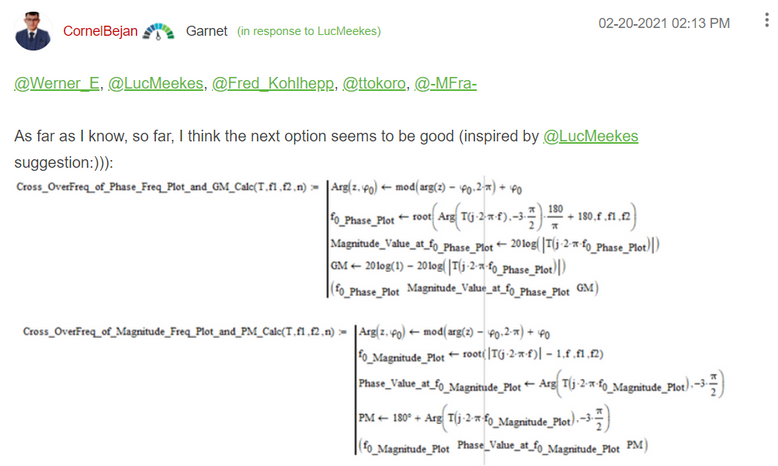
The functions I use for calculating Gain Margin (GM) and Phase Margin (PM) are:
The Plant Transfer Function is:
Case 1: fmax = 10e6 => GM_Tc = -22.627 db & f0_Phase_Plot_Tc = 2.471 kHz.
Case 2: fmax = 10e8 => GM_Tc = 138.668 db & f0_Phase_Plot_Tc = 52710 kHz.
Does anyone have any idea what is the reason for this happening in the case of GM?
Calculations and graphs were made in Mathcad 15.
Attached is the Mathcad 15 file with the details.
Thank you.
Best regards.
- Mark as New
- Bookmark
- Subscribe
- Mute
- Subscribe to RSS Feed
- Permalink
- Notify Moderator
The phase of your Tc only dips across the 180° border in a very narrow frequency range, from 1894 Hz to 2795 Hz. The root function that tries to find the crossing needs two endpoints, one on each side of the crossing.
If you stretch your range too far, root will not find any crossing:
It requires a more versatile root finding function to do what you need.
Success!
Luc
- Mark as New
- Bookmark
- Subscribe
- Mute
- Subscribe to RSS Feed
- Permalink
- Notify Moderator
@Werner_E, @LucMeekes, @Fred_Kohlhepp
I think there is something wrong with these two functions, how they are built, but I do not know what, at least so "foreshadowed" and I deduce from my more detailed checks by the last resort.
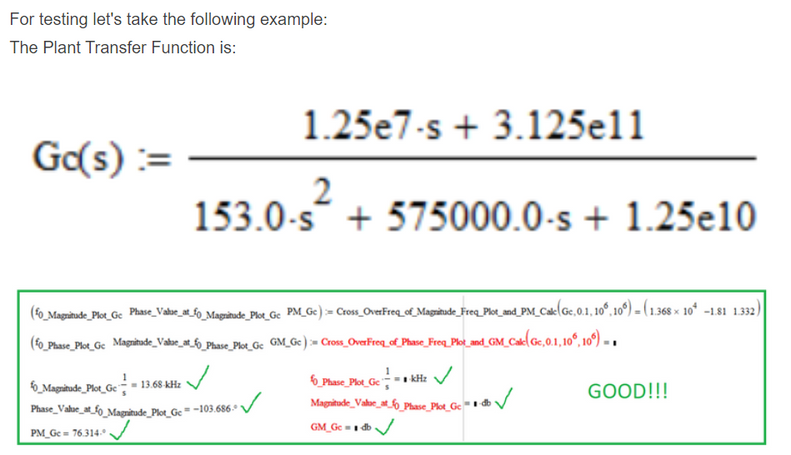
Let's take the following example:
The Plant Transfer Function is:
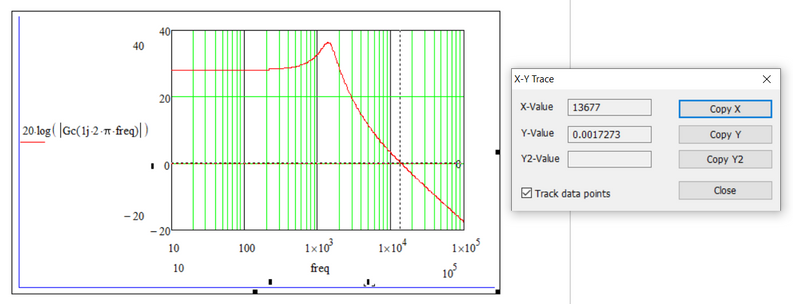
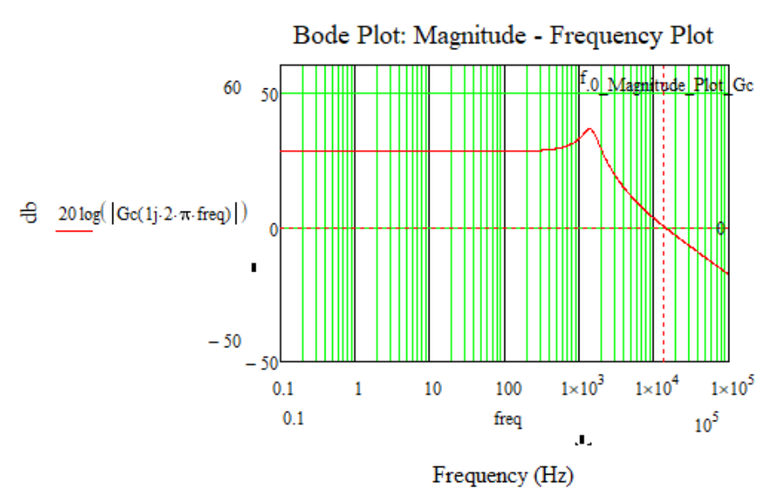
The axis cutting frequency of 0 decibels on the magnitude-frequency plot gives well, as it results from the function.
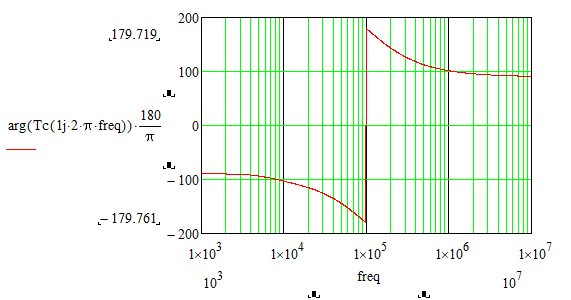
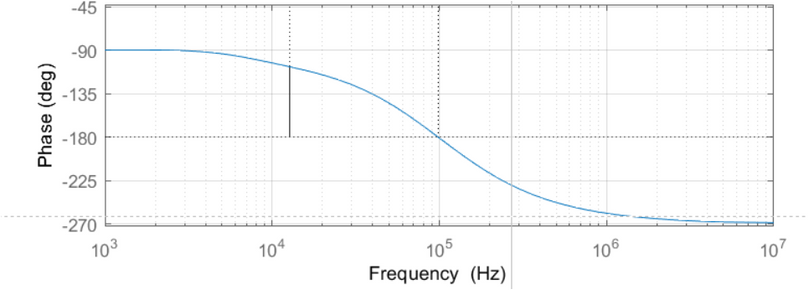
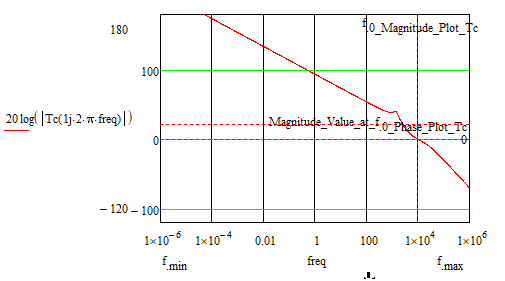
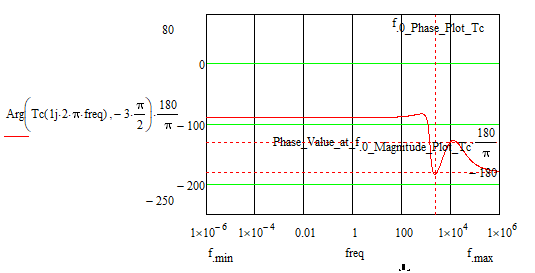
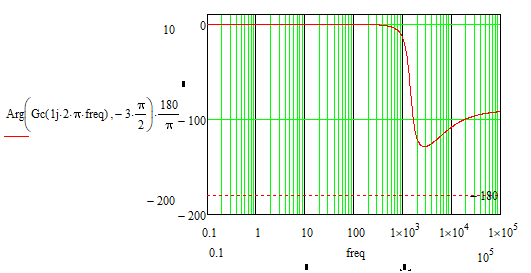
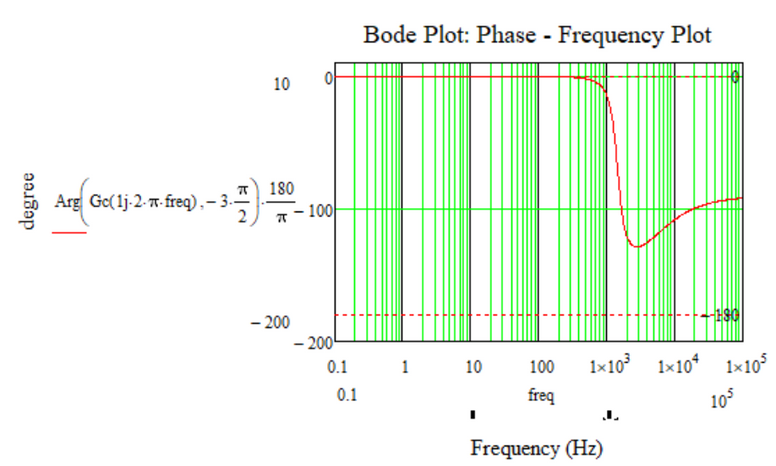
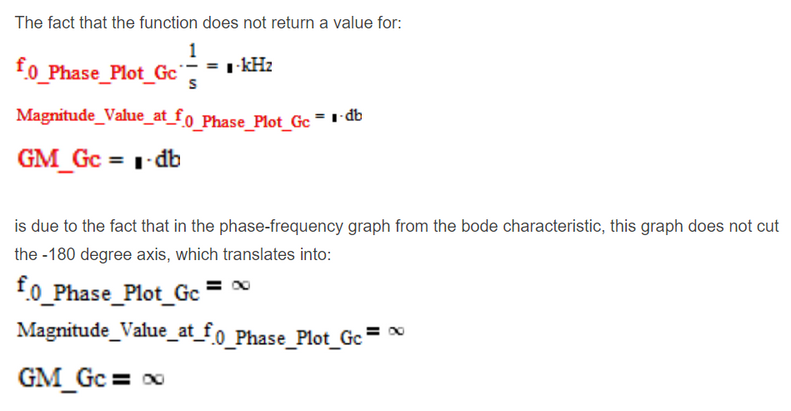
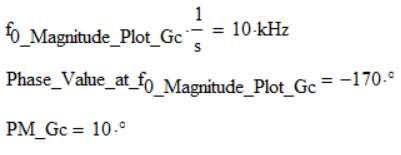
The phase-frequency plot does not even cut the axis at -180 degrees so it cannot define a cut-off frequency for this graph, but the function returns a frequency value (this means that the graph cuts the axis at -180 degrees, which is not true).
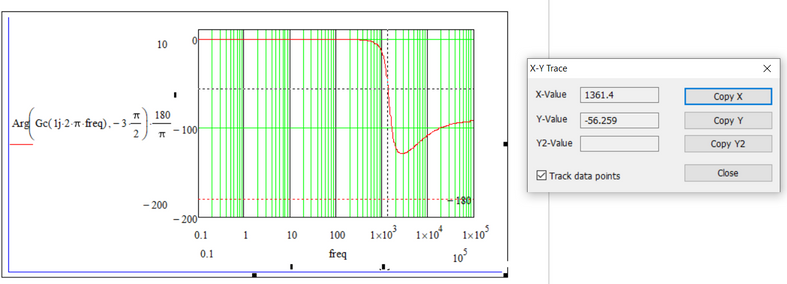
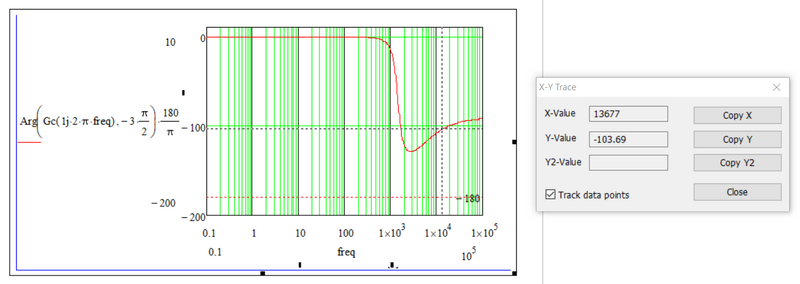
Reading the value in degrees corresponding to the cutoff frequency read from the magnitude - frequency graph (approximately 13.614kHz) results in a value of -56,259 degrees, which means that the phase margin (PM) is 180 degrees - 56,258 degrees = 123,741 degrees, and the result of the function is -103,666 degrees, and 76,313 degrees, respectively, which is a discrepancy.
Hmm, something strange is happening, because it does not shoot the values read from the graph with the values calculated by functions ...
I was so happy :)) because it seemed to work great 🙂
What do you think is missing or wrong?
Thank you.
Best regards.
- Mark as New
- Bookmark
- Subscribe
- Mute
- Subscribe to RSS Feed
- Permalink
- Notify Moderator
I have a mistake regarding the previous comment:
The Phase Margin (PM) is well calculated with the corresponding function used.
In the previous comment, from the graph, I read at the frequency of approximately 1.3 kHz, but it must be at the frequency of approximately 13 kHz (as much as the cutting frequency at 0 decibels is read from the magnitude-frequency characteristic).
degree.
But the problem remains in calculating the Gain Margin (GM) with the corresponding function used
This is because the phase-frequency graph does not cut the -180 degree line, which should normally lead to an infinite Gain Margin (GM) (or at least a large value).
- Mark as New
- Bookmark
- Subscribe
- Mute
- Subscribe to RSS Feed
- Permalink
- Notify Moderator
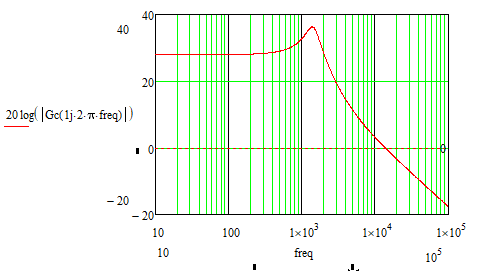
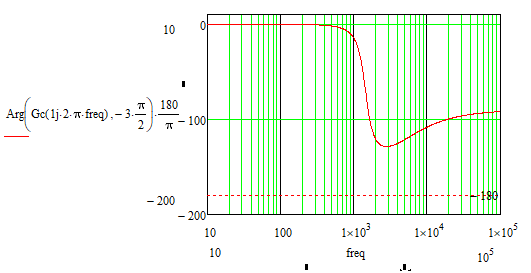
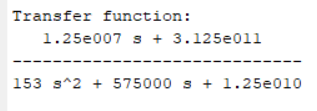
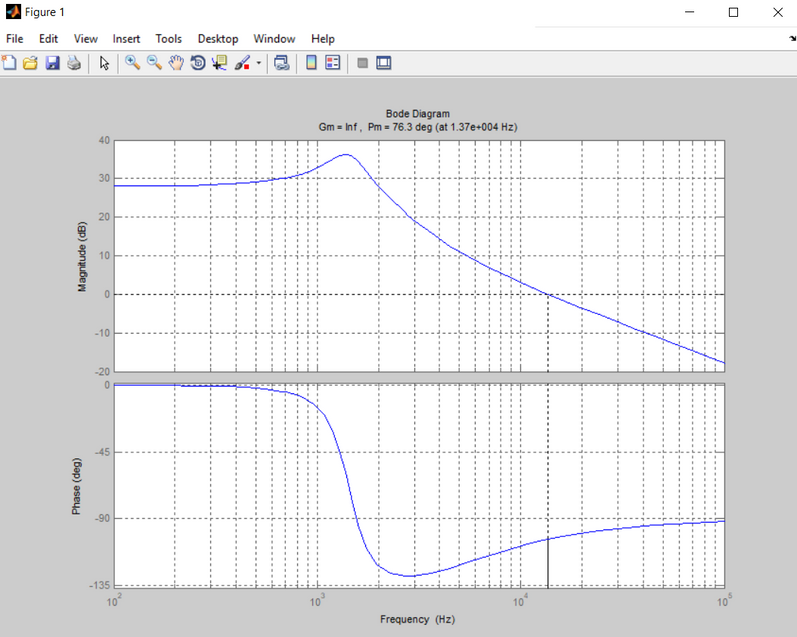
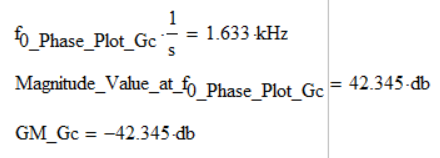
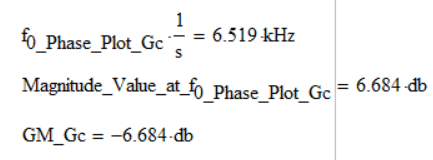
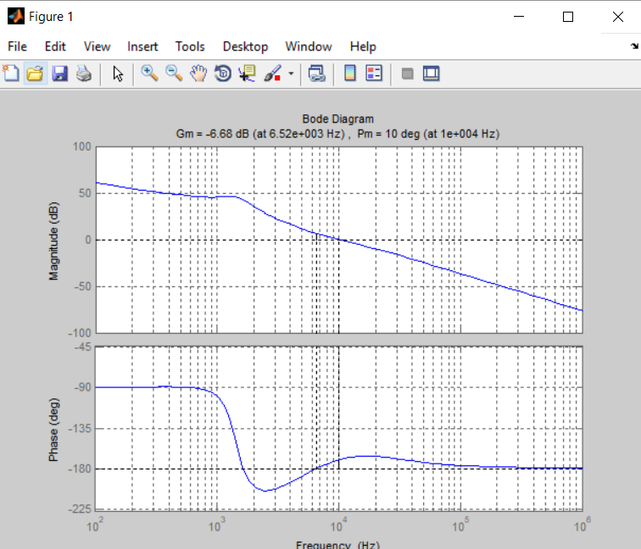
As a check, I put the transfer function corresponding to Gc (s) in Matlab and drew the corresponding bode diagrams.
Mathcad:
Matlab:
- Mark as New
- Bookmark
- Subscribe
- Mute
- Subscribe to RSS Feed
- Permalink
- Notify Moderator
Therefore, the function that I suspect would not have good results is:
Any suggestions/ideas/opinions?
Thank you.
- Mark as New
- Bookmark
- Subscribe
- Mute
- Subscribe to RSS Feed
- Permalink
- Notify Moderator
The 'GM' function calculates the frequency at which the phase crosses -180 deg, using the Lookup function. That is, it tries to find -180 deg in the phase array, and once found, it takes the corresponding frequency.
However, it doesn't accurately search for -180 deg in the phase array. Due to the argument "near" it is satisfied when it finds a phase value near -180 deg, hopefully the nearest value. This means that it will always find a phase 'near' -180 deg, even though the phase never crosses that line.
Note that the 'PM' function also uses the argument "near" to the Lookup function, so you will be able to find a problem there with a transfer function that remains below 0 dB...
As I said earlier, if you want a set of functions for GM and PM that works accurately for any transfer function, you'll need a more equipped set of functions.
Success,
Luc
- Mark as New
- Bookmark
- Subscribe
- Mute
- Subscribe to RSS Feed
- Permalink
- Notify Moderator
Yes, it is.
I'm just trying to make my life easier, through some automation to find certain values on the two graphs.
But in general, it is ok with what has been said in this topic and what solutions have been brought.
Thank you very much.
Best regards.
- Mark as New
- Bookmark
- Subscribe
- Mute
- Subscribe to RSS Feed
- Permalink
- Notify Moderator
@LucMeekes, @Werner_E, @Fred_Kohlhepp
I hope you didn't mind that I posted small peculiarities or questions that I found along the way while I was trying various aspects.
Thank you.
Best regards.
- Mark as New
- Bookmark
- Subscribe
- Mute
- Subscribe to RSS Feed
- Permalink
- Notify Moderator
Anyway, your comments helped me a lot (and those of others, of course).
Thank you for that:).
- Mark as New
- Bookmark
- Subscribe
- Mute
- Subscribe to RSS Feed
- Permalink
- Notify Moderator
They show the same results.
- Tags:
- Prime_6.0
- Mark as New
- Bookmark
- Subscribe
- Mute
- Subscribe to RSS Feed
- Permalink
- Notify Moderator
I can't open the Mathcad file you posted (I use Mathcad 15).
Can you put a picture, something, of what you want to show?
- Mark as New
- Bookmark
- Subscribe
- Mute
- Subscribe to RSS Feed
- Permalink
- Notify Moderator
Hi,
for sure, in the files that I published some time ago in the community, that is: "https://community.ptc.com/t5/PTC-Mathcad/3-low-pass-I-order-digital-filter-equivalent-to- linear-classic", and others i.e 4), 5), i ran into this problem but I didn't take it into account, what do you think? if you can't open the page then in search write "3) LOW PASS", it should be reachable.
- Mark as New
- Bookmark
- Subscribe
- Mute
- Subscribe to RSS Feed
- Permalink
- Notify Moderator
Only showing the same results.
- Tags:
- Prime 6.0
- Mark as New
- Bookmark
- Subscribe
- Mute
- Subscribe to RSS Feed
- Permalink
- Notify Moderator
@Werner_E, @LucMeekes, @Fred_Kohlhepp, @ttokoro, @-MFra-
Ah, yes, the graphics are fine. That was not the idea, at least not in the last posts.
The graphs were discussed at the beginning of this topic, and, in principle, it was solved.
The ideas from the last posts and comments were in the context in which I could evaluate the two characteristics in certain points of them, in the sense of finding through certain functions that solve for the Phase Margin (PM) and the Gain Margin (GM) for different transfer functions in an automatic (or at least semi-automatic) way and not reading fully manually on the graphs.
Which sounds good, that is, okay with what it looks like on the graphs.
A few more things appear, such as:
1) If the phase-frequency graph does not cut the -180 degree axis then GM should return the value of infinity.
2) If the phase-frequency graph cuts the -180 degree axis by more than one point (2.3, etc., as shown below (*)), then a single point should be extracted or the frequency search range should be narrowed only for a single cut of the graph with the axis of -180 degrees, to get a correct answer.
But it's okay because they keep you awake and attentive to what you're doing, and then they make you not forget how to calculate the Phase Margin (PM) and the Gain Margin (GM) from the graphs when you do not have a computer :).
((*)
For example, Matlab takes into account, at least as far as I can see until now, the last point that cuts the -180 degree axis.
For the above completeness in Mathcad:
)
but as @LucMeekes says:
Even so, it works well.
I'm pleased.
I am satisfied with the suggestions and solutions that came from the other colleagues and that were referred to in this topic. Also, as I said above, the results are good, from the latest research.
Thank you all.
Best regards.
- « Previous
-
- 1
- 2
- Next »

