Community Tip - If community subscription notifications are filling up your inbox you can set up a daily digest and get all your notifications in a single email. X
- Subscribe to RSS Feed
- Mark Topic as New
- Mark Topic as Read
- Float this Topic for Current User
- Bookmark
- Subscribe
- Mute
- Printer Friendly Page
Filter out out NaN and Complex results?
- Mark as New
- Bookmark
- Subscribe
- Mute
- Subscribe to RSS Feed
- Permalink
- Notify Moderator
Filter out out NaN and Complex results?
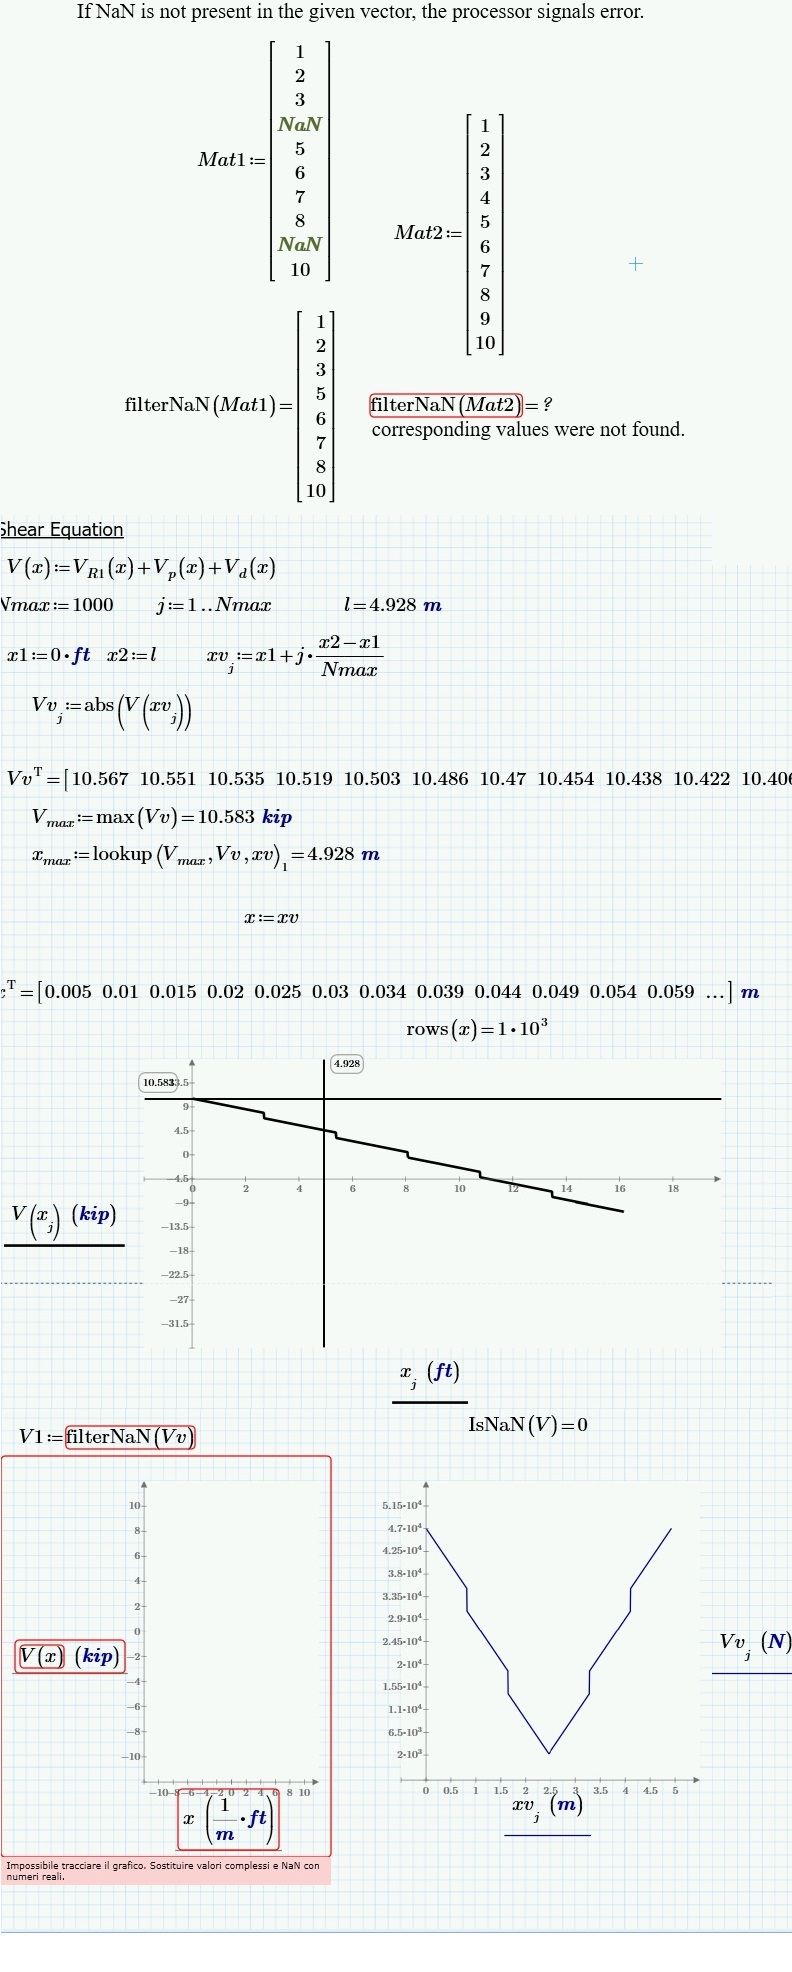
In the attached worksheet there is a plot error (Plotting failed. Replace complex values and NaN by real numbers.) I've tried using failterNaN to remove the NaNs. Is there a way to remove the complex results?
Solved! Go to Solution.
- Labels:
-
Other
Accepted Solutions
- Mark as New
- Bookmark
- Subscribe
- Mute
- Subscribe to RSS Feed
- Permalink
- Notify Moderator
I can't open your sheet, only see the jpg's.
In Filter 1 you define ORIGIN:=0 (that's default any way.)
In Filter 2 you have

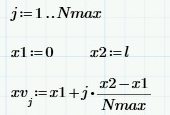
so the first element of xv is not defined, 0 by default, but no units.
I don't see where you define x, but:

suggests that x has no units--you put in feet and Mathcad divided by meters to balance the units.
I think that's your basic problem.
- Mark as New
- Bookmark
- Subscribe
- Mute
- Subscribe to RSS Feed
- Permalink
- Notify Moderator
I can't open your sheet, only see the jpg's.
In Filter 1 you define ORIGIN:=0 (that's default any way.)
In Filter 2 you have

so the first element of xv is not defined, 0 by default, but no units.
I don't see where you define x, but:

suggests that x has no units--you put in feet and Mathcad divided by meters to balance the units.
I think that's your basic problem.
- Mark as New
- Bookmark
- Subscribe
- Mute
- Subscribe to RSS Feed
- Permalink
- Notify Moderator
- Mark as New
- Bookmark
- Subscribe
- Mute
- Subscribe to RSS Feed
- Permalink
- Notify Moderator
Thanks! It's interesting to see the entire sheet..
- Mark as New
- Bookmark
- Subscribe
- Mute
- Subscribe to RSS Feed
- Permalink
- Notify Moderator
filterNaN does not work the way you use it and would not help anyway.
A 2D plot will only fail with that error if ALL values are NaN or invalid and I suspect that the latter is the case.
I can't read P3.1 and I could not be bothered to switch between three JPGs to debug.
But I would suggest you try to evaluate your function V for a simple single value.
What happens if you type V(2 ft)= ? Where does the error trace to?
EDIT: Fred could possible be right (again). Try to define a range variable for x, like x:=1ft, 1ft+1in .. 10 ft or whatever seems appropriate.
- Mark as New
- Bookmark
- Subscribe
- Mute
- Subscribe to RSS Feed
- Permalink
- Notify Moderator
Just remote connected to a machine with P31 and can confirm, that Fred is right.

- Mark as New
- Bookmark
- Subscribe
- Mute
- Subscribe to RSS Feed
- Permalink
- Notify Moderator

- Mark as New
- Bookmark
- Subscribe
- Mute
- Subscribe to RSS Feed
- Permalink
- Notify Moderator
Thank you all very much, the issue was that x was not defined.


