Community Tip - Your Friends List is a way to easily have access to the community members that you interact with the most! X
- Subscribe to RSS Feed
- Mark Topic as New
- Mark Topic as Read
- Float this Topic for Current User
- Bookmark
- Subscribe
- Mute
- Printer Friendly Page
Form an equation from table data
- Mark as New
- Bookmark
- Subscribe
- Mute
- Subscribe to RSS Feed
- Permalink
- Notify Moderator
Form an equation from table data
Hi,
I have a table of data as given below. I want a function or equation of the data. So that I can find the y value for desired x value.
Please guide me how to do that in Mathcad. I'm using Mathcad Prime 9.0
| x | y |
| 6.2 | 215 |
| 9.1 | 153 |
| 13 | 111 |
| 15 | 97 |
| 18 | 82 |
| 22 | 67 |
| 24 | 62 |
| 27 | 55 |
| 30 | 50 |
| 33 | 46 |
| 36 | 42 |
| 39 | 39 |
| 43 | 35 |
| 47 | 33 |
| 51 | 30 |
- Labels:
-
Statistics_Analysis
- Mark as New
- Bookmark
- Subscribe
- Mute
- Subscribe to RSS Feed
- Permalink
- Notify Moderator
- Mark as New
- Bookmark
- Subscribe
- Mute
- Subscribe to RSS Feed
- Permalink
- Notify Moderator
Hi,
Thank you for the detail.
When I re-calculate Y using f(x) function, I'm getting values with +/-1.6 error. How to minimize the error further?
| x | y (Existing data) | Y (Calculated data using function f(x)) | Error (y-Y) |
| 6.2 | 215 | 216.6173939 | -1.617393929 |
| 9.1 | 153 | 152.0112222 | 0.9887777664 |
| 13 | 111 | 109.3707378 | 1.629262187 |
| 15 | 97 | 95.83819461 | 1.161805388 |
| 18 | 82 | 80.99427715 | 1.005722847 |
| 22 | 67 | 67.29994691 | -0.2999469128 |
| 24 | 62 | 62.10633191 | -0.1063319106 |
| 27 | 55 | 55.70858169 | -0.7085816934 |
| 30 | 50 | 50.54613325 | -0.5461332521 |
| 33 | 46 | 46.28949998 | -0.2894999786 |
| 36 | 42 | 42.71728555 | -0.7172855481 |
| 39 | 39 | 39.6751177 | -0.6751176959 |
| 43 | 35 | 36.25596522 | -1.255965218 |
| 47 | 33 | 33.39831321 | -0.3983132065 |
| 51 | 30 | 30.97302218 | -0.9730221783 |
- Mark as New
- Bookmark
- Subscribe
- Mute
- Subscribe to RSS Feed
- Permalink
- Notify Moderator
Change the assuming function Y(x):=ax^b such as ax^b+c, ax^3+bx^2+cx^1+d, etc..
- Mark as New
- Bookmark
- Subscribe
- Mute
- Subscribe to RSS Feed
- Permalink
- Notify Moderator
Andra
- Mark as New
- Bookmark
- Subscribe
- Mute
- Subscribe to RSS Feed
- Permalink
- Notify Moderator
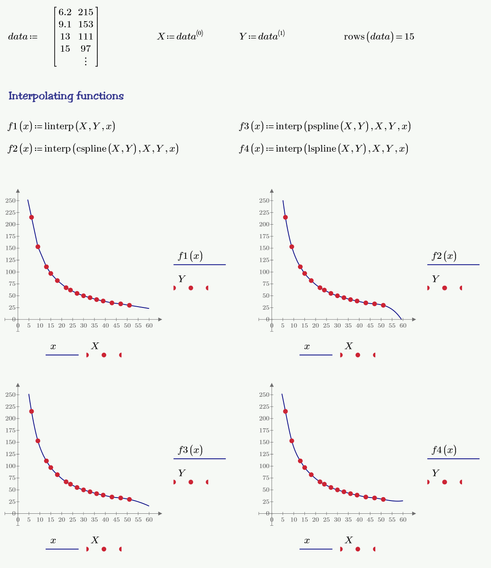
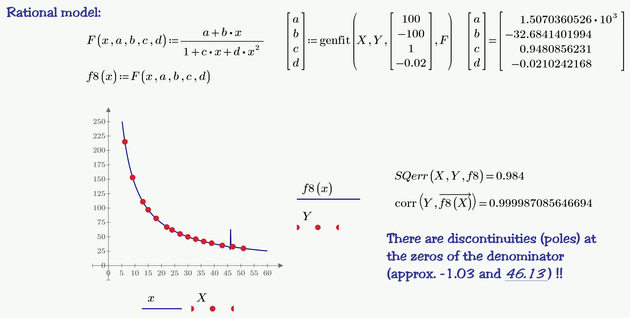
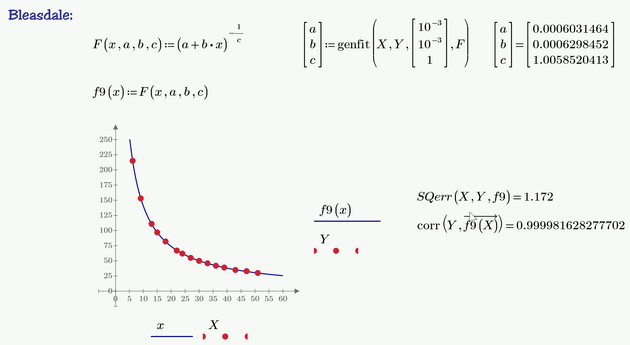
Basically you have the choice between an interpolation or a function fit.
In case of an interpolation in Prime you have the choice between linear interpolation and cubic spline interpolation. An interpolated function runs exactly through all the given data points, but its behaviour inbetween might not always be as expected or desired.
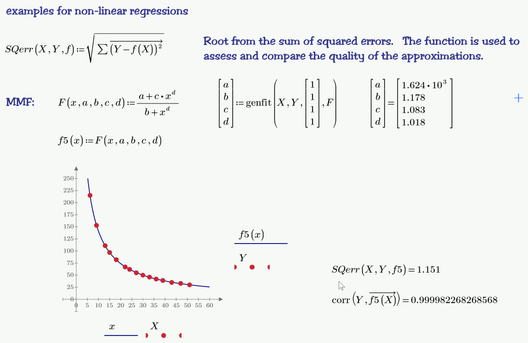
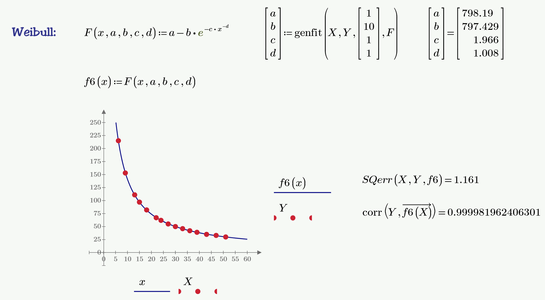
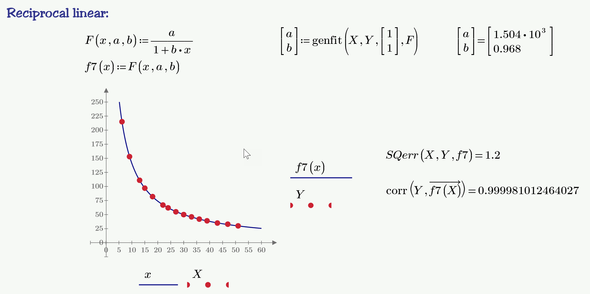
In case of a function fit (regression) usually you get a function whose graph may not include any of the given data points exactly (as in Terrys appraoch) but gives an overall good fit. You have to guess which function type may apply as Prime provides not means to autoselect an appropriate function type like specialized programs like CurveExpert Pro will do.
If you need further help, come back here and ask and don't forget to attach your worksheet.
So first you will have to decide if you need an interpolation or a regression.
Here are a few examples for both:


