
Turn on suggestions
Auto-suggest helps you quickly narrow down your search results by suggesting possible matches as you type.
Showing results for
Please log in to access translation
Turn on suggestions
Auto-suggest helps you quickly narrow down your search results by suggesting possible matches as you type.
Showing results for
Community Tip - When posting, your subject should be specific and summarize your question. Here are some additional tips on asking a great question. X
Translate the entire conversation x
Please log in to access translation
Options
- Subscribe to RSS Feed
- Mark Topic as New
- Mark Topic as Read
- Float this Topic for Current User
- Bookmark
- Subscribe
- Mute
- Printer Friendly Page
Fourier-Analysis
Nov 03, 2016
01:24 PM
- Mark as New
- Bookmark
- Subscribe
- Mute
- Subscribe to RSS Feed
- Permalink
- Notify Moderator
Please log in to access translation
Nov 03, 2016
01:24 PM
Fourier-Analysis
Hello!
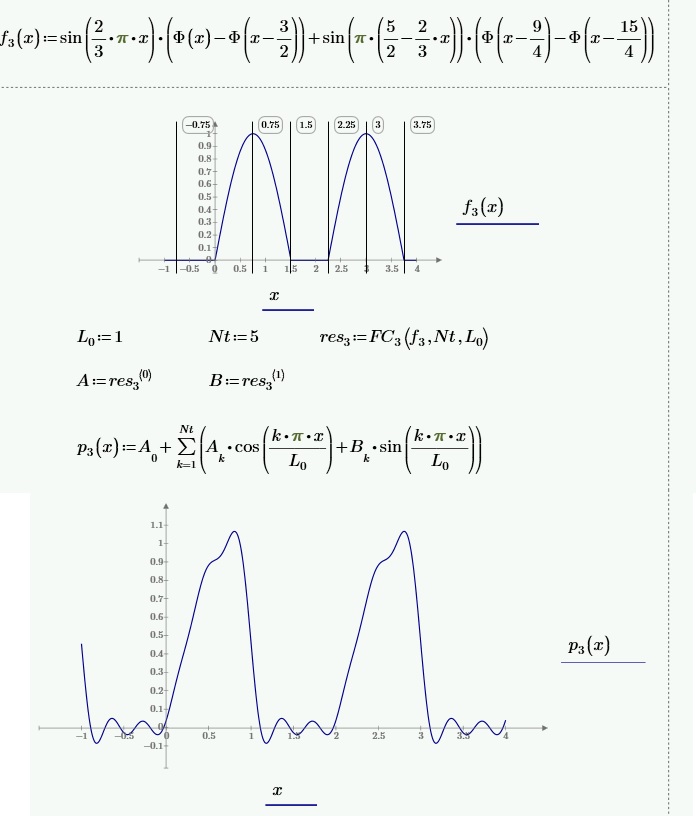
What's wrong with the last Fourier-Analysis of a sinus Function?

Thank you for your Help.
Volker
Volker
Solved! Go to Solution.
Labels:
- Labels:
-
Statistics_Analysis
ACCEPTED SOLUTION
Accepted Solutions
Nov 03, 2016
04:53 PM
- Mark as New
- Bookmark
- Subscribe
- Mute
- Subscribe to RSS Feed
- Permalink
- Notify Moderator
Please log in to access translation
Nov 03, 2016
04:53 PM
> The wave is not fully displayed.
And if you would read my various answers her you also would know why.
You don't have to use the Heaviside function to define your signal, but doing so forces all values outside the given intervals to be zero.
In your more clear representation with the if else structure the signal is not defined outside and so you got the error, You could add a simple else at the end to set the function to zero for all other values - which would be good practice anyway.
Your signal is (now) zero for -1 < x < -3/4 but it should be part of sine in this range. Thats the reason your signal is not fully represented by the Fourier-series.
And as already written there are two ways to deal with the problem:
1) Define f.3 in a way so that it also shows the sine for values lower than -3/4
2) Don't integrate from -L to L in FC which is from -1 to 1 in case of your f.3. Use a more flexible function FC as already suggested. In case of your (or F.M.'s) f.3 you would have to integrate at least from -3/4 to 5/4 to get the result you expect.
35 REPLIES 35
Nov 03, 2016
01:34 PM
- Mark as New
- Bookmark
- Subscribe
- Mute
- Subscribe to RSS Feed
- Permalink
- Notify Moderator
Please log in to access translation
Nov 03, 2016
01:34 PM
Can't see. Prime sheet lacks.
From the PDF: What is the difference between the function definitions for FC(f,N,L), FC.1(f,BN,L), FC.2(f,BN,L) andFC.3(f,BN,L)? They appear to be th same !
What if, instead of the offending res.3:=FC.3(f.3,Nt,L)
you call: res.3:=FC(f.3,Nt,L) ?
Luc
Nov 03, 2016
02:28 PM
- Mark as New
- Bookmark
- Subscribe
- Mute
- Subscribe to RSS Feed
- Permalink
- Notify Moderator
Please log in to access translation
Nov 03, 2016
02:28 PM
Luc,
"From the PDF: What is the difference between the function definitions for FC(f,N,L), FC.1(f,BN,L), FC.2(f,BN,L) andFC.3(f,BN,L)? They appear to be th same !"
There are 3 Functions: f, f1, f2 displayed in diagramms and converted into Fourier-functions which are also displayed in diagramms.
"
What if, instead of the offending res.3:=FC.3(f.3,Nt,L)
you call: res.3:=FC(f.3,Nt,L) ?"
I have created a seperat worksheet without the indizes "3" and the error occured again -see attached pdf.
"Can't see. Prime sheet lacks."
I hadn't sent you a mathcad-File 
Thanks, Volker
Volker
Nov 03, 2016
02:22 PM
- Mark as New
- Bookmark
- Subscribe
- Mute
- Subscribe to RSS Feed
- Permalink
- Notify Moderator
Please log in to access translation
Nov 03, 2016
02:22 PM
You should at least have told us what exactly the error message is you get at the definition of res.3
The reason for the error seems to be that you integrate from -1 to 1, but your function f.3 is not defined in the range -1 to -3/4!
It would be more versatile if you rewrite your FC function with two arguments for the start and end of integration interval instead of providing just L. That way you are more flexible in defining the functions you wish to analyze.
Some remarks: There is no need for different functions FC.1, FC.2, FC.3. One fits all.
And in Mathcad you can write something like if -2 < x < 4, so you don't need to write if ( x>-2 ) ^ ( x < 4 ).
Nov 03, 2016
02:35 PM
- Mark as New
- Bookmark
- Subscribe
- Mute
- Subscribe to RSS Feed
- Permalink
- Notify Moderator
Please log in to access translation
Nov 03, 2016
02:35 PM
"Some remarks: There is no need for different functions FC.1, FC.2, FC.3. One fits all."
That was my point in asking for any differences between them...
Luc
Nov 03, 2016
02:52 PM
- Mark as New
- Bookmark
- Subscribe
- Mute
- Subscribe to RSS Feed
- Permalink
- Notify Moderator
Please log in to access translation
Nov 03, 2016
02:52 PM
> That was my point in asking for any differences between them...
Yes, and I found no differences at all, thats making all but one of them obsolete. They are all the same and assume a signal f which is defined in [-L; L] which seems to be the problem as f.3 is not defined at the full range which sure would throw an error.
Therefore I suggested to rewrite FC (one fits all) so that it works with a flexible interval. In case of f.3 it would be avoidable effort to define the parabola additionally i -1 <x< -3/4.
Nov 03, 2016
02:58 PM
- Mark as New
- Bookmark
- Subscribe
- Mute
- Subscribe to RSS Feed
- Permalink
- Notify Moderator
Please log in to access translation
Nov 03, 2016
02:58 PM
Hi Volker
f3 is not well defined for mathcad Prime. Using the step function, everything works.
Nov 03, 2016
03:28 PM
- Mark as New
- Bookmark
- Subscribe
- Mute
- Subscribe to RSS Feed
- Permalink
- Notify Moderator
Please log in to access translation
Nov 03, 2016
03:28 PM
> Using the step function, everything works.
No, it doesn't. You set the interval -1 to -3/4 to zero that way, but there should be part of a parabola here!
So you are analyzing a different signal as was intended. There should be a parabola in the range 1 <x< 1.5 but you have just zero there! I am talking about the fourier-row here, not the signal you defined
You see the error even in your coarse approximation with five sines.
Nov 03, 2016
03:40 PM
- Mark as New
- Bookmark
- Subscribe
- Mute
- Subscribe to RSS Feed
- Permalink
- Notify Moderator
Please log in to access translation
Nov 03, 2016
03:40 PM
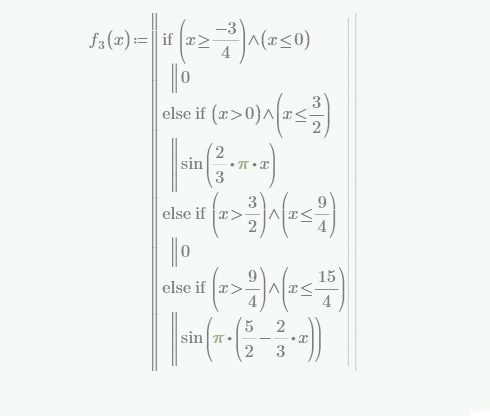
I used the f3 function defined by Volker at the end of his pdf file, here reported below:
Nov 03, 2016
03:45 PM
- Mark as New
- Bookmark
- Subscribe
- Mute
- Subscribe to RSS Feed
- Permalink
- Notify Moderator
Please log in to access translation
Nov 03, 2016
03:45 PM
Read my answer as to why the sheet of the OP is not working to see what I mean!
I don't doubt that you defined the same signal as the OP but your signal is also not OK to be treated with the FC routine provided.
So you either would have to redefine the signal f.3 so that we have a nice sine at the beginning of the interval starting with x=-1, or we have to change the function FC (ehich I would prefer) so that we don't use a static interval of integration from -L to L.
Nov 03, 2016
04:20 PM
- Mark as New
- Bookmark
- Subscribe
- Mute
- Subscribe to RSS Feed
- Permalink
- Notify Moderator
Please log in to access translation
Nov 03, 2016
04:20 PM
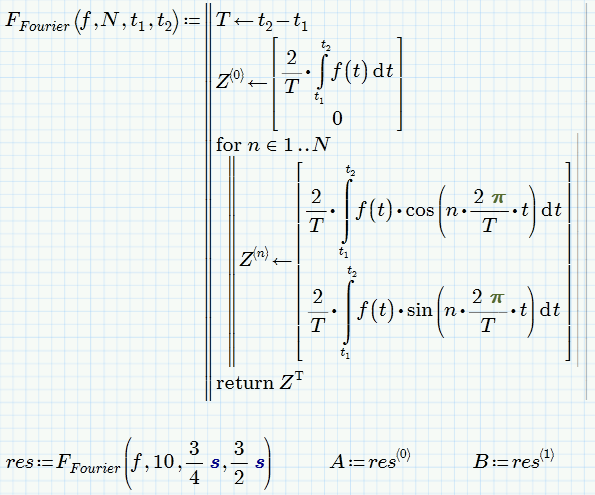
You should tell the author of the program. I define the Fourier coefficients so:

Nov 03, 2016
04:40 PM
- Mark as New
- Bookmark
- Subscribe
- Mute
- Subscribe to RSS Feed
- Permalink
- Notify Moderator
Please log in to access translation
Nov 03, 2016
04:40 PM
> You should tell the author of the program.
You may have noticed that I did 😉
> I define the Fourier coefficients so:
And thats approx. what I was suggesting - a better and more flexible way to deal with signals which are not defined over a symmetric interval around 0.
EIther provide start valu x0 and period or provide start an end value (and calculate the period from hem). Both ways have its merits as long as you are able to slide along the abscissa with your window.
But you defined the signal with the same flaw as the Volker and used his FC routine. And while with your function definition you get a result, its not the intended result. Thats what I was pointing at.
Nov 03, 2016
03:42 PM
- Mark as New
- Bookmark
- Subscribe
- Mute
- Subscribe to RSS Feed
- Permalink
- Notify Moderator
Please log in to access translation
Nov 03, 2016
03:42 PM
EDIT: read "sine" instead of "parabola" in my post above.!
Nov 03, 2016
03:55 PM
- Mark as New
- Bookmark
- Subscribe
- Mute
- Subscribe to RSS Feed
- Permalink
- Notify Moderator
Please log in to access translation
Nov 03, 2016
03:55 PM
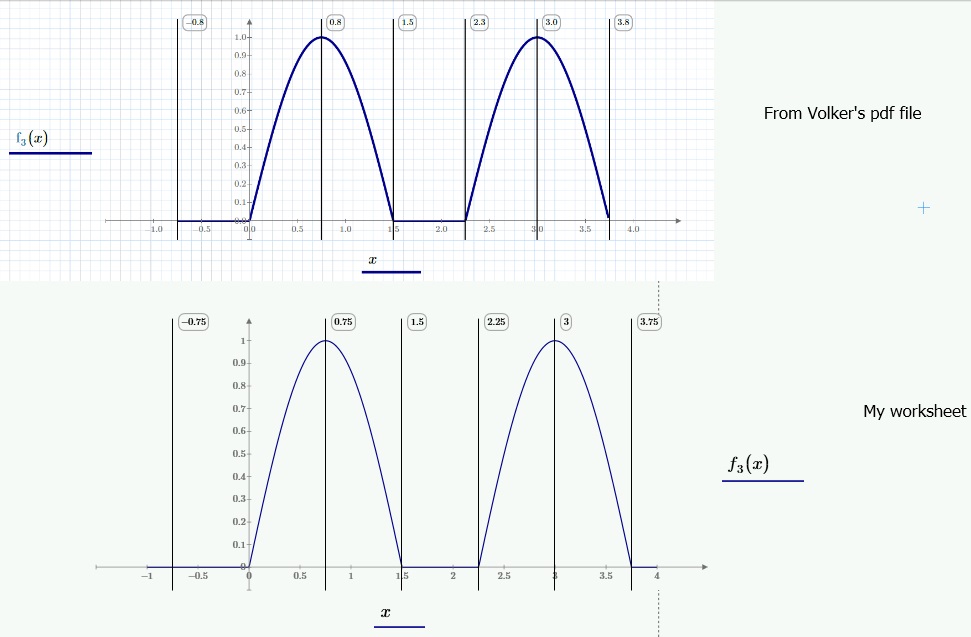
There is no difference between the f3 function defined by Volker and mine, see picture:
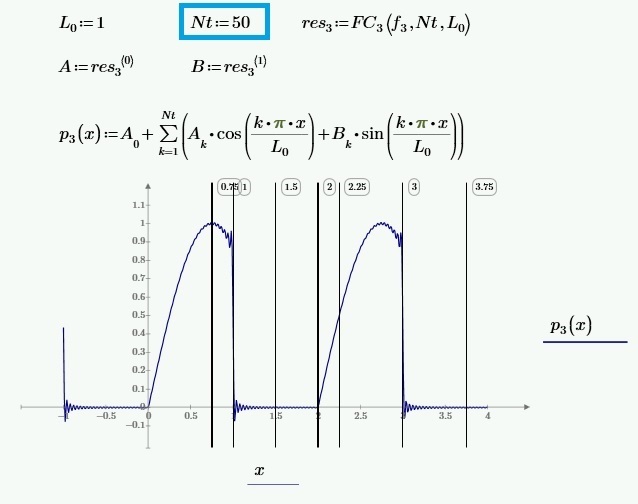
increasin Nt, results:
Nov 03, 2016
04:19 PM
- Mark as New
- Bookmark
- Subscribe
- Mute
- Subscribe to RSS Feed
- Permalink
- Notify Moderator
Please log in to access translation
Nov 03, 2016
04:19 PM
Exactly this is now my current problem:
The wave is not fully displayed.
See Attachement.
Volker
Nov 03, 2016
04:25 PM
- Mark as New
- Bookmark
- Subscribe
- Mute
- Subscribe to RSS Feed
- Permalink
- Notify Moderator
Please log in to access translation
Nov 03, 2016
04:25 PM
The development in Fourier series of a function must fulfill the conditions of Dirichlet. It must be done in the period, which in your program is equal to L. All that is outside is cut off.
Nov 03, 2016
04:36 PM
- Mark as New
- Bookmark
- Subscribe
- Mute
- Subscribe to RSS Feed
- Permalink
- Notify Moderator
Please log in to access translation
Nov 03, 2016
04:36 PM
There's nothing 'wrong' now. You got what you asked for, but it may be (very) different from what you expected. That is because:
1. Your (1/2 sine) wave is defined from 0 to 1.5.
2. You do the fourier transform over the interval from -1 to +1.
This means that for the fourier analysis the part from -1 to +1 is considered a single period of the signal and is assumed to repeat over and over again.
So your one period of a signal consists of a duration 1 where it is flat, and another duration 1 where it is part (2/3rds) of the positive half of a sine wave.
In your first sheet it did not work because you had the part from -1 to -3/4 undefined (as Werner pointed out). With your new definition, using the step function, you corrected that implicitly. Wherever the step function is not 1, it is 0 (that is: defined).
Luc
Nov 03, 2016
04:53 PM
- Mark as New
- Bookmark
- Subscribe
- Mute
- Subscribe to RSS Feed
- Permalink
- Notify Moderator
Please log in to access translation
Nov 03, 2016
04:53 PM
> The wave is not fully displayed.
And if you would read my various answers her you also would know why.
You don't have to use the Heaviside function to define your signal, but doing so forces all values outside the given intervals to be zero.
In your more clear representation with the if else structure the signal is not defined outside and so you got the error, You could add a simple else at the end to set the function to zero for all other values - which would be good practice anyway.
Your signal is (now) zero for -1 < x < -3/4 but it should be part of sine in this range. Thats the reason your signal is not fully represented by the Fourier-series.
And as already written there are two ways to deal with the problem:
1) Define f.3 in a way so that it also shows the sine for values lower than -3/4
2) Don't integrate from -L to L in FC which is from -1 to 1 in case of your f.3. Use a more flexible function FC as already suggested. In case of your (or F.M.'s) f.3 you would have to integrate at least from -3/4 to 5/4 to get the result you expect.
Nov 04, 2016
06:15 AM
- Mark as New
- Bookmark
- Subscribe
- Mute
- Subscribe to RSS Feed
- Permalink
- Notify Moderator
Please log in to access translation
Nov 04, 2016
06:15 AM
Werner,
your hint was the bringer!
"2) Don't integrate from -L to L in FC which is from -1 to 1 in case of your f.3. Use a more flexible function FC as already suggested. In case of your (or F.M.'s) f.3 you would have to integrate at least from -3/4 to 5/4 to get the result you expect."
I increased The Variable L to L=4 and it works! -see Attachement
And the Heavyside function works also perfectly!
Thank you for your Help!
Volker
Nov 04, 2016
07:07 AM
- Mark as New
- Bookmark
- Subscribe
- Mute
- Subscribe to RSS Feed
- Permalink
- Notify Moderator
Please log in to access translation
Nov 04, 2016
07:07 AM
> I increased The Variable L to L=4 and it works! -see Attachement
I am sorry to have to say this, but I guess it only looks like it works!
Do a plot of p3 from x=-20 to x=20 to see what I mean!
Nov 04, 2016
08:27 AM
- Mark as New
- Bookmark
- Subscribe
- Mute
- Subscribe to RSS Feed
- Permalink
- Notify Moderator
Please log in to access translation
Nov 04, 2016
08:27 AM
Werner, you are right
Hmmmm, what can i do now?
very mysterious...

Volker
Nov 04, 2016
09:22 AM
- Mark as New
- Bookmark
- Subscribe
- Mute
- Subscribe to RSS Feed
- Permalink
- Notify Moderator
Please log in to access translation
Nov 04, 2016
09:22 AM
> very mysterious...
Not, not really, as some people here already tried to explain!
Look at your function f.3. Its is zero for all negative value of x, Then beginning with x=0 we have the two sine peaks and then again all is zero.
Now you do calculate a Fourier series and you use the range -4<=x<=4 as the function to do the analysis with. And it is assumed, that this part of your function is repeated periodically (period is 8).
Do you have the picture of your function in the range -4<=x<=4 in you mind! Now copy that part and repeat it all over. Thats what you get with your Fourier series. Nothing mysterious.
Again , to get what you have in mind would either need a change in the function definition of f.3 or a change in your function FC. I suggested the latter and proposed a function which works with start and end of the interval as arguments. F.M. has posted a similar function which used the start value and the length of the period as argument.
Just for testing purpose so you see what I mean:
Use the function f.3 of your very first post (or the Heaviside variant whch F.M. posted).
Use L=1
Rewrite FC so that the limits of your two integrals are -L/2 and 3*L/2 instead of -L and L and see if you like the result.
Nov 05, 2016
10:36 AM
- Mark as New
- Bookmark
- Subscribe
- Mute
- Subscribe to RSS Feed
- Permalink
- Notify Moderator
Please log in to access translation
Nov 05, 2016
10:36 AM
Werner,
you are right. I'm not so familiar with Fourier-Analysis.
I made some changes like you suggested- The Parameter L is set to 1.125 to get the appropriate width of the function FC3 (if set to L=1 the width does not be the same as of f3.
>see attachement. It works!
Thank you again for your Help
Volker
Nov 04, 2016
09:39 AM
- Mark as New
- Bookmark
- Subscribe
- Mute
- Subscribe to RSS Feed
- Permalink
- Notify Moderator
Please log in to access translation
Nov 04, 2016
09:39 AM
To take it to the extreme:
If you defined your function to have two sine peaks in the time from 0 to 4, and after reconstruction of the signal from the fourrier coefficients you expect it to contain only two sine peaks in the period from 0 to 4, then you must set L:=infinite. Which means you have to integrate from -infinity to +infinity in your integrals. I suspect you'll need to increase Nt to a much larger value...
Luc
Nov 05, 2016
02:48 PM
- Mark as New
- Bookmark
- Subscribe
- Mute
- Subscribe to RSS Feed
- Permalink
- Notify Moderator
Please log in to access translation
Nov 05, 2016
02:48 PM
I redefined the Functions (all without indizes):
f(x) in the Intervall -3/4 to 3/2 (one Period)
L as start value 3/2 (positive end-value of f(x)
setting the Integrals from -3/4 to L
The plotting of p(x) has now a period of 3 and the period of f(x) is only 9/4.
What's wrong?
Volker
Nov 05, 2016
08:48 PM
- Mark as New
- Bookmark
- Subscribe
- Mute
- Subscribe to RSS Feed
- Permalink
- Notify Moderator
Please log in to access translation
Nov 05, 2016
08:48 PM
> What's wrong?
Maybe you should first tell us, what exactly you expect the result to be!
In general the formulas for the Fourier series have to conform to two conditions:
1) The integration interval is one period T which is repeated over an over again.
2) The integral has to be multiplied by 2/T
In your first sheet L was T/2. You integrate from -L to L which is a length of 2 L = T and multiplied by 1/L = 2/T
My suggestion was to integrate from -L/2 to 3*L/2 which still is an interval of 2L=T. But your integral runs from -3/4 to L and you chose L=3/2 which mean the size of the integration interval is 9/4 but you still multiply by 1/L=2/3. this may give unexpected results.
I am nor sure what exactly you are trying to do and which result you expect.
In general: You define a signal f(t), Then you define an Interval from t.1 to t.2. When you chose the limits of your integral from t.1 to t.2, you will have to multiply by 2/(t.2-t.1). This would give you a Fourier series representing a signal which equals your signal f(t) only within the limits t.1 to t.2 and repeats it periodically.
Your original function FC chooses those limits always symmetrically to zero with +-L and your problem was that your signal f(t) was not correctly defined in the lower part of that interval
Nov 05, 2016
09:12 PM
- Mark as New
- Bookmark
- Subscribe
- Mute
- Subscribe to RSS Feed
- Permalink
- Notify Moderator
Please log in to access translation
Nov 05, 2016
09:12 PM
"Maybe you should first tell us, what exactly you expect the result to be!"
i want to have the Fourier-Signal like shown the f(x) plot from my last post (please see attachement "Fourier_Analysis_4_Seite_3.pdf")
From the Limit of -3/4 to 3/2
simply nothing more and nothing less.
Volker
Nov 06, 2016
06:37 AM
- Mark as New
- Bookmark
- Subscribe
- Mute
- Subscribe to RSS Feed
- Permalink
- Notify Moderator
Please log in to access translation
Nov 06, 2016
06:37 AM
> i want to have the Fourier-Signal like shown the f(x) plot from my last post
> From the Limit of -3/4 to 3/2
Two possible interpretations:
1) Luc was right with his assumption that you just want to show the peaks of f(x) and nothing else. That means a signal which is zero most of the time. Then read his answer. Fourier is not made for this.
2) This is what I assumed in all my answers above. You want a new function (via Fourier) where the part oft f(x) between -3/4 and 3/2 is repeating over and over again. Then the period T of that function is 3/2-(-3/4)=9/4 and you would have to use e.g.

Its up to you to chose a start value x.0.
You may use
and you would not need to change anything in your definition of f(x). Thats what I meant when I wrote that you should modify your function FC to be more flexible concerning the interval of integration.
But if you insist that you want to integrate from -T/2 to T/2

(that is integral from -L to L in your function FC), you must use a function f(x) which also is correct defined in that very interval.
This was not the case in your first post (the function was not defined at all in the lower range beginning from -L) and using F.M.'s definition meant using a wrong signal as here the function was set to zero where it should not be zero.
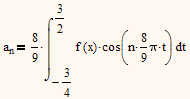
In you last sheet the error is, that you integrate from -3/4 to 3/2 (in a crude way, as -3/4 is hard coded, 3/3 is a variable L) but you did not multiply your integrals by 2/T=8/9 but by 1/L=2/3. This has to fail of course. In you last sheet L is not the half period L=T/2 anymore but just the upper integral limit. Also the frequencies of your sine and cosine integrands are wrong cause you use L her and not the true period T.
Nov 06, 2016
09:15 AM
- Mark as New
- Bookmark
- Subscribe
- Mute
- Subscribe to RSS Feed
- Permalink
- Notify Moderator
Please log in to access translation
Nov 06, 2016
09:15 AM
Hi Werner,
you are absolut right and I now understand what you meant in your demonstration .(your Example was very vividly for me).
I changed the Limits for the Integrals according to the right period and got finaly the right solution for the Fourier-series.
Thanks a lot! 
Volker
Volker
Nov 06, 2016
09:58 AM
- Mark as New
- Bookmark
- Subscribe
- Mute
- Subscribe to RSS Feed
- Permalink
- Notify Moderator
Please log in to access translation
Nov 06, 2016
09:58 AM
The argument L in F.Fourier (formerly FC) is now meaningless and not used at all. On the other hand x1 and x2 are now global variables.
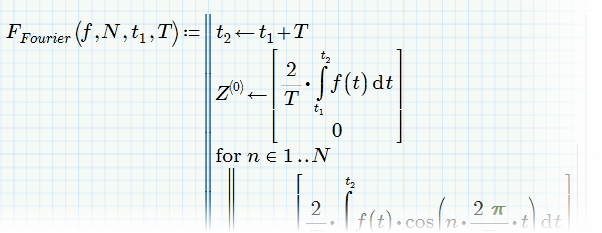
May I suggest something like this
or this
And don't use the unit seconds in 2 s /T - the coefficients you calculate must have the same dimension as f(t) and not f(t) times seconds.
That way you also won't have to divide by s when separating the coefficients in A and B
P.S.: Die Überschrift verspricht ein Gleichrichter-Signal. Allerdings stellt das von dir produzierte Signal keine Halbwellengleichrichtung dar! Da müsstest du zB die x.1=-3/4 schon durch -3/2 ersetzen (auch in der Definition von f).


