Community Tip - Learn all about PTC Community Badges. Engage with PTC and see how many you can earn! X
- Subscribe to RSS Feed
- Mark Topic as New
- Mark Topic as Read
- Float this Topic for Current User
- Bookmark
- Subscribe
- Mute
- Printer Friendly Page
GRAPH plotting using generated data
- Mark as New
- Bookmark
- Subscribe
- Mute
- Subscribe to RSS Feed
- Permalink
- Notify Moderator
GRAPH plotting using generated data
Hello,
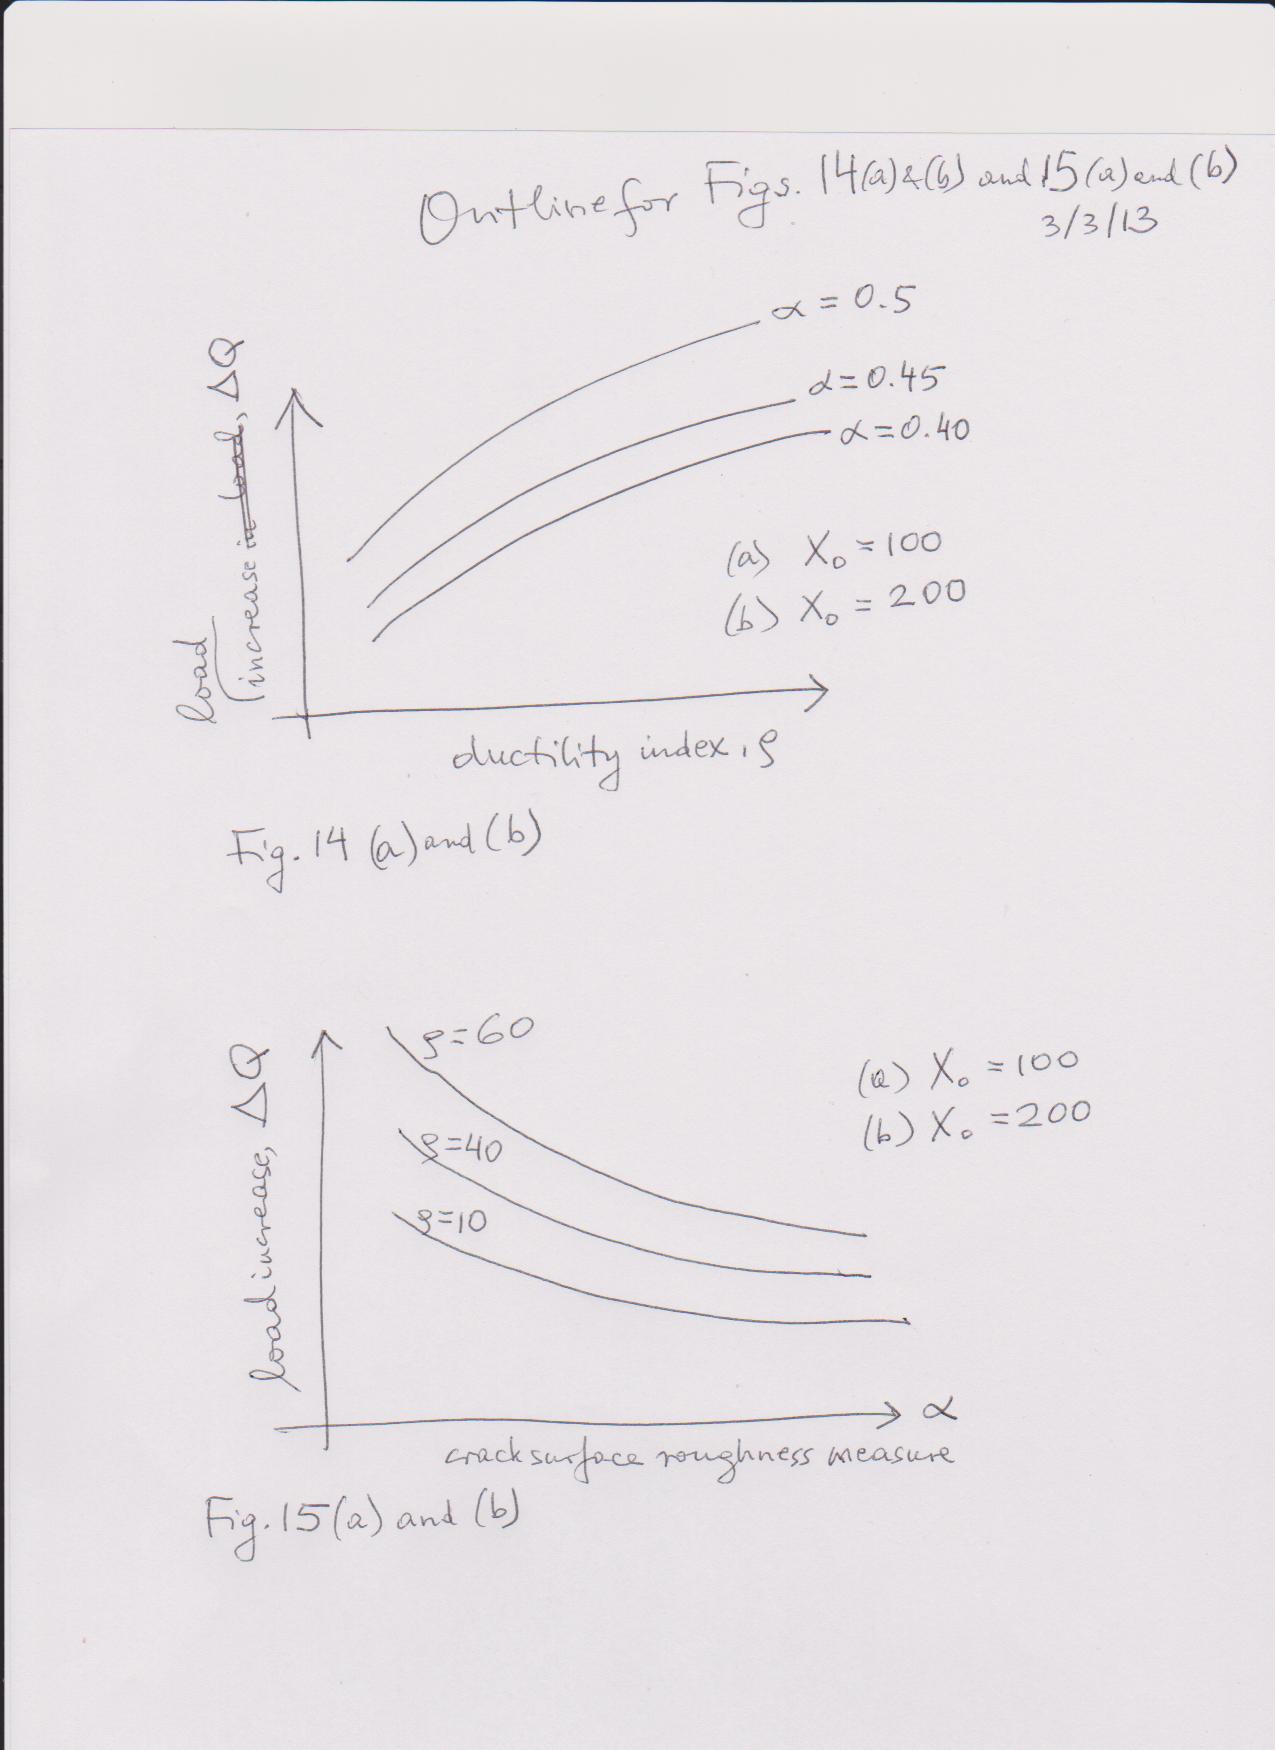
I have a worksheet (attached), with generated DeltaQ values.
I would like to plot graphs as depicted bellow:
Could anyone please help me to obtain these plots?
Please note: change rho and x0 globally at the bottom of the worksheet to get the corresponding values of DeltaQ.
Thank you,
Anousheh

Solved! Go to Solution.
- Labels:
-
Statistics_Analysis
Accepted Solutions
- Mark as New
- Bookmark
- Subscribe
- Mute
- Subscribe to RSS Feed
- Permalink
- Notify Moderator
- Mark as New
- Bookmark
- Subscribe
- Mute
- Subscribe to RSS Feed
- Permalink
- Notify Moderator
- Mark as New
- Bookmark
- Subscribe
- Mute
- Subscribe to RSS Feed
- Permalink
- Notify Moderator
Hello Alan,
Thank you. Very neat program. I appreciate this.
Is it easy to do the same thing for other graph?
Thanks,
Anousheh
- Mark as New
- Bookmark
- Subscribe
- Mute
- Subscribe to RSS Feed
- Permalink
- Notify Moderator
Anousheh Rouzbehani wrote:
...
Is it easy to do the same thing for other graph?
Yes. If you look carefully at the short program just above the first graph you should be able to produce something similar with alpha replacing rho.
Alan
- Mark as New
- Bookmark
- Subscribe
- Mute
- Subscribe to RSS Feed
- Permalink
- Notify Moderator
Hello Alan,
Thank you again. This is going to help me a lot.
I appreciate your time.
Regards,
Anousheh


