Community Tip - You can change your system assigned username to something more personal in your community settings. X
- Subscribe to RSS Feed
- Mark Topic as New
- Mark Topic as Read
- Float this Topic for Current User
- Bookmark
- Subscribe
- Mute
- Printer Friendly Page
Generating a hemispherical dome surface plot using a cosine function
- Mark as New
- Bookmark
- Subscribe
- Mute
- Subscribe to RSS Feed
- Permalink
- Notify Moderator
Generating a hemispherical dome surface plot using a cosine function
I want to use Mathcad 6.0 to create a color-coded mesh surface plot of a hemispherical dome whose height ranges between 0 and 1.0 as defined by the function cos(πx/2a), 0 ≤ x ≤ a, with a = 300. The surface is “swept out” by taking this curve [plotted along the x axis] and rotating it a full 360 degrees about x= 0.
Solved! Go to Solution.
- Labels:
-
Mathcad Usage
Accepted Solutions
- Mark as New
- Bookmark
- Subscribe
- Mute
- Subscribe to RSS Feed
- Permalink
- Notify Moderator
Here is a quick utility function which creates the number of slices demanded and also takes care that they all have equal height.
It will work OK only if the function provided is monotone. Otherwise there might be different regions of x values with the same z-values which would make creating the slices much more difficult. So the function assumes that the min and max values for z are found at either end of the x-range provided.
- Mark as New
- Bookmark
- Subscribe
- Mute
- Subscribe to RSS Feed
- Permalink
- Notify Moderator
@bobg100x wrote:
I want to use Mathcad 6.0 to create a color-coded mesh surface plot of a hemispherical dome whose height ranges between 0 and 1.0 as defined by the function cos(πx/2a), 0 ≤ x ≤ a, with a = 300. The surface is “swept out” by taking this curve [plotted along the x axis] and rotating it a full 360 degrees about x= 0.
I don't have much experience with Prime 3D plots, but AFAIA, you can't apply a colormap to a 3D surface. I'm glad to be corrected on this.
However, it is possible to (partially) code a surface by building it up in strips. Use the CreateMesh function to create the strips and then individually type the name of each strip into the 3DPlot placeholders and set the characteristics you want.. I've got Prime 7, so posting the worksheet won't help you.
It would be straightforward in Mathcad 15.
Stuart
- Mark as New
- Bookmark
- Subscribe
- Mute
- Subscribe to RSS Feed
- Permalink
- Notify Moderator
Here's Stuarts file for Prime 6
Success!
Luc
- Mark as New
- Bookmark
- Subscribe
- Mute
- Subscribe to RSS Feed
- Permalink
- Notify Moderator
Yes, I am using Mathcad 6.0 Prime. Because I have had very limited experience using this software, I'm totally flummoxed by the solution provided. For instance, I don't understand how "Curve(a, b)" defined in the worksheet relates to the cosine function I'm working with; also what does "K" denote? Frankly, its quite obvious I bit off much more than I can chew and should not have bothered those in the Mathcad community who responded to my question. My only recourse is to familiarize myself with the CreateMesh feature before continuing this discussion.
Bob
- Mark as New
- Bookmark
- Subscribe
- Mute
- Subscribe to RSS Feed
- Permalink
- Notify Moderator
For instance, I don't understand how "Curve(a, b)" defined in the worksheet relates to the cosine function I'm working with;
It doesn't relate to your cosine function at all. Stuart demonstrated the cumbersome method of creating a couple of colored stripes using a normal sphere with radius 1.
also what does "K" denote?
You asked for a "color-coded mesh surface plot" and it was interpreted as if you would like it to be colored coded by height. Prime does not offer the ability to coloring a surface using a (more or less) continuous color map like Mathcad 15 and below do.
So Stuart suggested a workaround by putting together the sphere by a couple of slices of equal height. Each of theses slices must be plotted separately and can be colored differently from the other.
K simply is the number of slices you want to use. If you change K, you also must change the arguments in the plot and color them the way you like.
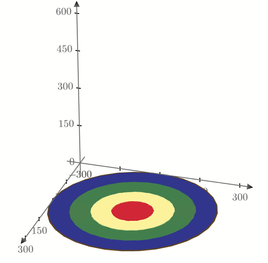
Here is the hemisphere with your cosine function. To slice the dome I simply divided the x-range into K equal parts and I added a slice by changing K from 4 to 5. Be aware that by simply dividing the x-range into equal part the heights of the slices are not equal as you can clearly see in the plot!
I guess you are not expecting equal scale on all axis. Otherwise you would have to manually change the axis limits and the dome with height 1 would look like this 😈:
(the bottom brown slice is hardly visible)
Prime 6 sheet attached
- Mark as New
- Bookmark
- Subscribe
- Mute
- Subscribe to RSS Feed
- Permalink
- Notify Moderator
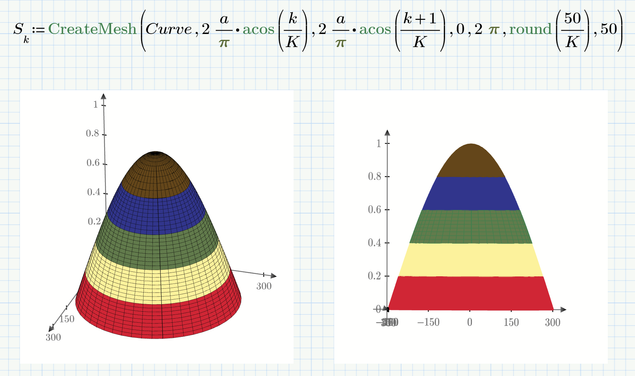
OK, here is a variant with slices of equal height
Prime 6 sheet attached
- Mark as New
- Bookmark
- Subscribe
- Mute
- Subscribe to RSS Feed
- Permalink
- Notify Moderator
The variant with slices of equal height is exactly what I wanted- -thank you very much!
Would it be possible to change the slice colors to [all bright colors, from top to bottom] red, yellow, green, blue, purple?
Also, can a contour plot be created using the same colors I requested?
Bob
- Mark as New
- Bookmark
- Subscribe
- Mute
- Subscribe to RSS Feed
- Permalink
- Notify Moderator
@bobg100x wrote:
The variant with slices of equal height is exactly what I wanted- -thank you very much!
You are welcome
Would it be possible to change the slice colors to [all bright colors, from top to bottom] red, yellow, green, blue, purple?
Yes, you can color each of the slices individually using the normal Plot menu. But as PTC decided not to implement a decent color picker, you are limited to the 60 predefined colors.
Also, can a contour plot be created using the same colors I requested?
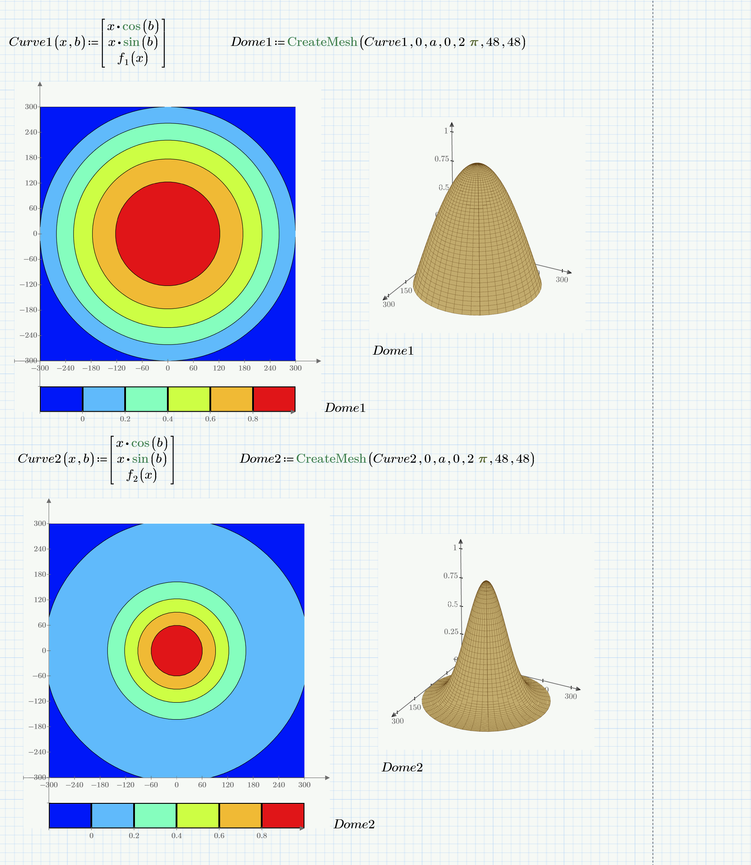
Nope. Using Primes contour plot limits you to one of six predefined color schemes. But at least you are allowed to edit the first, second and last value in the color legend. The rest is equally spaced corresponding to equal heights (which fortunately is what you are looking for anyway). In the pic below I set the limits to 0 and 1 and the second value to 0.1 which means a total of 10 slices.
If you find a color scheme which fits you needs you can try to simulate the same colors in the 3D plot.
Another option might be to use the normal 3D plot instead of the contour plot and fiddle around until you have the final view - quite difficult and you also loose the color legend.
- Mark as New
- Bookmark
- Subscribe
- Mute
- Subscribe to RSS Feed
- Permalink
- Notify Moderator
Thanks again for applying your obvious expertise to my question, Werner. Just wondering... Could you use the same methodology to create a color-coded mesh plot of an exponential decay-type of surface whose height ranges between (almost) 0 and 1.0 as defined by the function

- Mark as New
- Bookmark
- Subscribe
- Mute
- Subscribe to RSS Feed
- Permalink
- Notify Moderator
- Mark as New
- Bookmark
- Subscribe
- Mute
- Subscribe to RSS Feed
- Permalink
- Notify Moderator
@bobg100x wrote:
Thanks again for applying your obvious expertise to my question, Werner. Just wondering... Could you use the same methodology to create a color-coded mesh plot of an exponential decay-type of surface whose height ranges between (almost) 0 and 1.0 as defined by the function
, 0 ≤ x ≤ a, with a = 300 and c = 5.5. Visualize the surface as being swept out by taking this curve (plotted along the x axis) and rotating it a full 360 degrees about a vertical axis located at x = 0.
Are yout talking about the built-in contour plot or about Stuarts approach of creating the 3D plot using a couple of slices?
In any way you simply have to switch the cosine function for the new exp function as Luc just had shown (you have to recalculate his sheet to see the results).
In case of the 3D plot with slices you may notice that the slices won't have equal heights - this would require additional changes.
- Mark as New
- Bookmark
- Subscribe
- Mute
- Subscribe to RSS Feed
- Permalink
- Notify Moderator
Here is a quick utility function which creates the number of slices demanded and also takes care that they all have equal height.
It will work OK only if the function provided is monotone. Otherwise there might be different regions of x values with the same z-values which would make creating the slices much more difficult. So the function assumes that the min and max values for z are found at either end of the x-range provided.
- Mark as New
- Bookmark
- Subscribe
- Mute
- Subscribe to RSS Feed
- Permalink
- Notify Moderator
The easiest way! Without cone!
- Mark as New
- Bookmark
- Subscribe
- Mute
- Subscribe to RSS Feed
- Permalink
- Notify Moderator
@ValeryOchkov wrote:
The easiest way!
Hmm, I guess, when the OP wrote "I want to use Mathcad 6.0" he meant Prime 6 (also named Mathcad Prime 6) and not real Mathcad 6. And I am sure that you know that Prime does not support (out of the box) other coordinate systems than cartesian in its 3D plots.
I don't know but are you sure that old Mathcad 6 (dating back to 1995) provided similar 3D plot capabilities like your Mathcad 15?
- Mark as New
- Bookmark
- Subscribe
- Mute
- Subscribe to RSS Feed
- Permalink
- Notify Moderator
Unless the message has leaked through from an alternate universe where Mathcad Prime 6 has an M15 3DPlot analogue ... I feel a transdimensional experiment is called for. "Boris! To the lab, my trusty minion."
- Mark as New
- Bookmark
- Subscribe
- Mute
- Subscribe to RSS Feed
- Permalink
- Notify Moderator
Here's the plot requested by the OP, though modified in the sense that I changed a=300 to a=3, in Mathcad 6 (Yes, I fired up an old machine with Mathcad 6 plus installed).
Success!
Luc
- Mark as New
- Bookmark
- Subscribe
- Mute
- Subscribe to RSS Feed
- Permalink
- Notify Moderator
Nice, but the OP request the cosine curve to be rotated not about the x-axis but about x=0, which means an axis orthogonal to the x-axis. As he described the surface as a "dome" I supposed that the axis of rotation should be vertical.
BTW, when I open your sheet in MC15, I see this
When I create a new plot and format appropriate, I can duplicate your plot
- Mark as New
- Bookmark
- Subscribe
- Mute
- Subscribe to RSS Feed
- Permalink
- Notify Moderator
Guess you're right. I misread the rotation.
Don't know why Mathcad 15 would interpret the plot differently. Or Mathcad 11.... They must have changed some internal administration in one of the intermediate versions.
Bottom line is though: Even Mathcad 6, some 20 years ago, was ahead of Prime 7 in certain aspects.
Luc
- Mark as New
- Bookmark
- Subscribe
- Mute
- Subscribe to RSS Feed
- Permalink
- Notify Moderator
@LucMeekes wrote:
Guess you're right. I misread the rotation.
Don't know why Mathcad 15 would interpret the plot differently. Or Mathcad 11.... They must have changed some internal administration in one of the intermediate versions.
Bottom line is though: Even Mathcad 6, some 20 years ago, was ahead of Prime 7 in certain aspects.
Luc
On the other hand - its quite easy for a software to be ahead of Prime 7, especially when it comes to plotting and especially concerning 3D plots.
- Mark as New
- Bookmark
- Subscribe
- Mute
- Subscribe to RSS Feed
- Permalink
- Notify Moderator
@LucMeekes wrote:
Yes, I fired up an old machine with Mathcad 6 plus installed
You are not the only one 😉!
- Mark as New
- Bookmark
- Subscribe
- Mute
- Subscribe to RSS Feed
- Permalink
- Notify Moderator
Here's the corrected plot.
The difference between Mathcad 6 versus 11 and higher is that mathcad 6 requires the three matrices X, Y and Z to be separately placed in the 3d graph, while Mathcad 11 and higher require them to be enclosed in parentheses.
Luc
- Mark as New
- Bookmark
- Subscribe
- Mute
- Subscribe to RSS Feed
- Permalink
- Notify Moderator
Thank you for the effort you expended to answer my question, Luc. The apparent simplicity of generating my desired 3D plot using pre-Mathcad 6.0 Prime software makes me wish I had purchased the latter-type software.
Bob
- Mark as New
- Bookmark
- Subscribe
- Mute
- Subscribe to RSS Feed
- Permalink
- Notify Moderator
@ValeryOchkov wrote:
The easiest way!
In Mathcad<=15, yes. However, when I plot it, I get this after applying a colormap with the default settings:
Not only is the hemisphere in an unusual orientation for a hemisphere (unusual not incorrect, obviously), but the coloring also doesn't accord with the normal "vary by hemisphere height" display. An easy way to fix the colouring problem is to change the colormap direction:
Alternatively, change the coordinate ranges:
(And just for completeness, here's the default cylinder)
Stuart
I would suggest a change in the


