
Turn on suggestions
Auto-suggest helps you quickly narrow down your search results by suggesting possible matches as you type.
Showing results for
Please log in to access translation
Turn on suggestions
Auto-suggest helps you quickly narrow down your search results by suggesting possible matches as you type.
Showing results for
Community Tip - Need to share some code when posting a question or reply? Make sure to use the "Insert code sample" menu option. Learn more! X
Translate the entire conversation x
Please log in to access translation
Options
- Subscribe to RSS Feed
- Mark Topic as New
- Mark Topic as Read
- Float this Topic for Current User
- Bookmark
- Subscribe
- Mute
- Printer Friendly Page
Graph
Sep 29, 2020
06:42 PM
- Mark as New
- Bookmark
- Subscribe
- Mute
- Subscribe to RSS Feed
- Permalink
- Notify Moderator
Please log in to access translation
Sep 29, 2020
06:42 PM
Graph
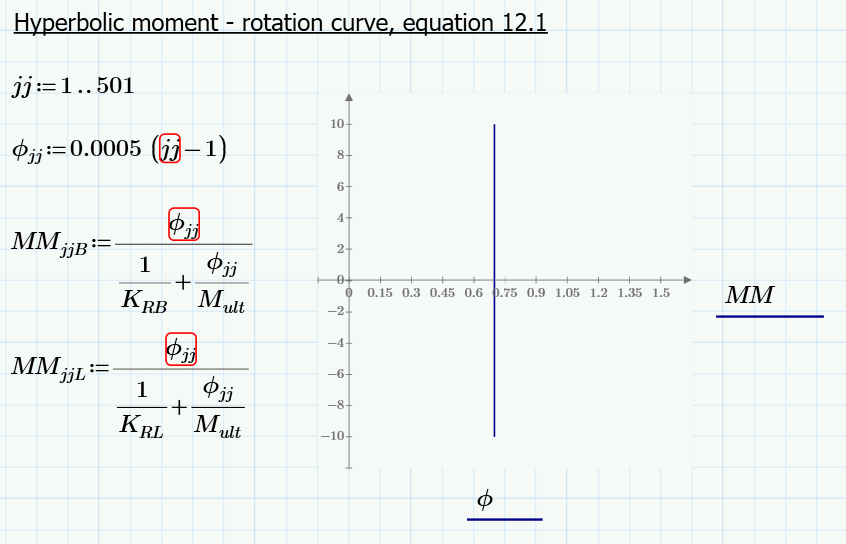
Hi,
I am not able to plot this graph on MATHCAD prime. Can anyone please help me?
TIA
Labels:
- Labels:
-
Civil_Engineering
3 REPLIES 3
Sep 29, 2020
07:41 PM
- Mark as New
- Bookmark
- Subscribe
- Mute
- Subscribe to RSS Feed
- Permalink
- Notify Moderator
Please log in to access translation
Sep 29, 2020
07:41 PM
You should always attach your worksheet as well, because its hard to impossible to debug a picture, especially as it doesn't show the error message as well.
My best guess is that you used the wrong type of index when you defined Phi. You must use the vector/matrix index and not the literal index. You can get the vector index by typing [ or use the ribbon menu.
Sep 29, 2020
08:08 PM
- Mark as New
- Bookmark
- Subscribe
- Mute
- Subscribe to RSS Feed
- Permalink
- Notify Moderator
Please log in to access translation
Sep 29, 2020
08:08 PM
Hi,
PFA. Sorry for not attaching the document previously. Also, how to add a placeholder in y-axis and x-axis.
Thanks
Sep 29, 2020
08:58 PM
- Mark as New
- Bookmark
- Subscribe
- Mute
- Subscribe to RSS Feed
- Permalink
- Notify Moderator
Please log in to access translation
Sep 29, 2020
08:58 PM
My guess was correct - you had used the wrong type of index!
Furthermore your plots were placed too high. Mathcad reads left to right and top to down. So the plots must be place AFTER the definition of the expressions.
Not sure what you mean with placeholders!? Do you mean labels? Primes native plots don't support labels (you may place text regions manually), don't support grid lines (there are workarounds available in this forum), don't support a second y-axis, ...
In Prime 6 PTC has added a third party module - the "diagram component" (see calculate ribbon). IMHO its a very badly integrated module which is rather slow, not WYSIWYG, does not support units and is quite unusable if you use a 4K display, as it does not scale properly. But you may give it a try - it supports labels, grid lines, etc.
Find attached your file with the correct indices and placement of plots.


