Community Tip - New to the community? Learn how to post a question and get help from PTC and industry experts! X
- Subscribe to RSS Feed
- Mark Topic as New
- Mark Topic as Read
- Float this Topic for Current User
- Bookmark
- Subscribe
- Mute
- Printer Friendly Page
Help me to learn Mathcad
- Mark as New
- Bookmark
- Subscribe
- Mute
- Subscribe to RSS Feed
- Permalink
- Notify Moderator
Help me to learn Mathcad
Hello,
I need some help in recalling and learning skills in order to do some research in material science.
This implies using Mathcad as a tool for interpreting electrical impedance data of semiconductor diodes.
I have been away from academic life for 10 years so I do not understand easily those mathcad files I used then.
Can you explain me how to integrate a function found on the basis of fitting?
Kristjan Laes
Solved! Go to Solution.
- Labels:
-
Mathcad Usage
Accepted Solutions
- Mark as New
- Bookmark
- Subscribe
- Mute
- Subscribe to RSS Feed
- Permalink
- Notify Moderator
- Mark as New
- Bookmark
- Subscribe
- Mute
- Subscribe to RSS Feed
- Permalink
- Notify Moderator
One possible way is to make the Integral function dependent on the index k
But your function Z.s returns far too high values for I > -2*10^-6 and so the integral will fail.
Note thats it a big difference if you call Z.s(I) vectorized or not vectorized.
I used "on error" to show where Z.s(I) fails:
- Mark as New
- Bookmark
- Subscribe
- Mute
- Subscribe to RSS Feed
- Permalink
- Notify Moderator
Is this due to the bad fit of the data?
Z.s(I) looks almost like a constant number, not big variations. In more simpler calculations it is even taken as a constant as a formula for Ohms law V=R*I.
- Mark as New
- Bookmark
- Subscribe
- Mute
- Subscribe to RSS Feed
- Permalink
- Notify Moderator
- Mark as New
- Bookmark
- Subscribe
- Mute
- Subscribe to RSS Feed
- Permalink
- Notify Moderator
Yes, this I wanted. Except Io there must be 0.
- Mark as New
- Bookmark
- Subscribe
- Mute
- Subscribe to RSS Feed
- Permalink
- Notify Moderator
@ptc-1793698 wrote:Yes, this I wanted. Except Io there must be 0.
Why? If you aren't interested in values of I that are less than zero it would be best to remove them (and the corresponding values of Z) from the start.
Incidentally, in my solution I integrated logZs. If you actually want the integral of the values of Zs, you will need to set Zs = 10^(logZs) first.
Alan
- Mark as New
- Bookmark
- Subscribe
- Mute
- Subscribe to RSS Feed
- Permalink
- Notify Moderator
I am interested in these values less that zero also. In the experiment the negative values are called reverse biases and positive forward biases. This zero is then as a reference in a middle. I will put exponent in the integral.
Kristjan
- Mark as New
- Bookmark
- Subscribe
- Mute
- Subscribe to RSS Feed
- Permalink
- Notify Moderator
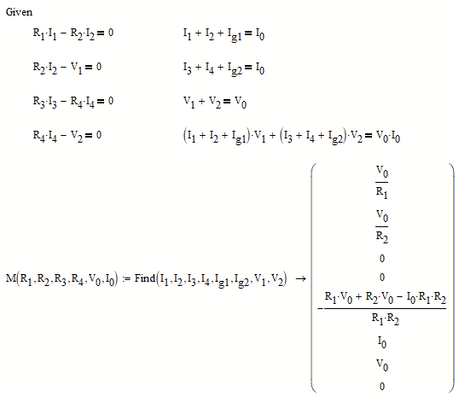
I am trying to solve an electrical network for its currents and voltages.
Does this system of equations have a solution?
Kristjan
- Mark as New
- Bookmark
- Subscribe
- Mute
- Subscribe to RSS Feed
- Permalink
- Notify Moderator
- Mark as New
- Bookmark
- Subscribe
- Mute
- Subscribe to RSS Feed
- Permalink
- Notify Moderator
Don't use vector/matrix indices (like R[1) but instead the literal index (like R.1)
- Mark as New
- Bookmark
- Subscribe
- Mute
- Subscribe to RSS Feed
- Permalink
- Notify Moderator
This helped.
What does the answer mean? Does it mean, that such a system does not have a solution, or something else?
- Mark as New
- Bookmark
- Subscribe
- Mute
- Subscribe to RSS Feed
- Permalink
- Notify Moderator
@ptc-1793698 wrote:
This helped.
What does the answer mean? Does it mean, that such a system does not have a solution, or something else?
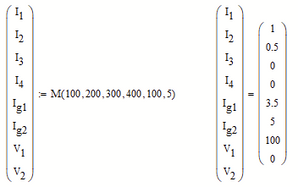
I am not sure what you mean!? I see a solution displayed! Do you see something different than I do? Why do you think that there might be no solution? Actually, as I will explain later, there is an infinite number of solutions because your equations are not independent.
You can now use the function you created:
Unfortunately it won't work with units because the function M you created would return a vector with mixed units.
The error message is about that the first function argument must be unitless !?
Mathcad 15 won't allow to display quantities with different dimensions (here voltage and current/amperage) in one vector.
It would be allowed to assigning the result of the solve block "find" to a vector of different variables and then displaying the variables singly or grouped in vectors of equal dimensions. But that way you would have to define your input variables in front of the solve block and can't create a function dependent on them.
It would be easier if Mathcad would allow for a vector of functions, but it doesn't. So here's a not-so-satisfactory solution for handling units using your function M, using two auxiliary functions MI and MV:
!! Are you aware that your eight equations are not independent - they are linear dependent and so you have one degree of freedom. You can chose one of the variables at will and then the others are dependent on it.
E.g. you could chose any value for V.2 - the symbolic evaluation of the Find command had chosen V.2=0 as you can see.
You can put all eight equation in a vector and solve it symbolically. You will get the same result was with the solve block (except the the result will be a row vector and not a column vector). But you can also add the "fully" modifier to see ALL possible solutions:
You see that V.2 = _z and _z can be any number. The other seven results are dependent on _z
- Mark as New
- Bookmark
- Subscribe
- Mute
- Subscribe to RSS Feed
- Permalink
- Notify Moderator
Thank you!
I now realized that something is wrong with the equations. The circuit has two nodes with no resistance in parallel with nodes with resistances. Hence a voltage drop in parallel with no drop in voltage.
This parallel node with no resistance came into my mind because of integration of values of resistivity elements gave as a result a bigger value of voltage than actually applied in the experiment. Hence I thought for a long time that there must be a current which does not pass resistor.
But it cant be so.
Another explanation for this finding is a built in voltage in parallel nodes . Here in attachment.
But again. One of the solutions is of zero value.
Can you tell is there a dependent equations among these six now?
I used your worksheet as a base.
- Mark as New
- Bookmark
- Subscribe
- Mute
- Subscribe to RSS Feed
- Permalink
- Notify Moderator
Can you tell is there a dependent equations among these six now?
unfortunately the six equations are dependent.
Adding the first two equations has the same result as subtracting the third from the fourth equation!
The symbolic solve is of no help here as the result is too large to display, but in the solve block you can chose one of the variables at will and you see that the other variables are dependent on it:
Maybe you'd like to post a picture of the circuit you are dealing with.
- Mark as New
- Bookmark
- Subscribe
- Mute
- Subscribe to RSS Feed
- Permalink
- Notify Moderator
- Mark as New
- Bookmark
- Subscribe
- Mute
- Subscribe to RSS Feed
- Permalink
- Notify Moderator
Are you tying arbitrary equations?
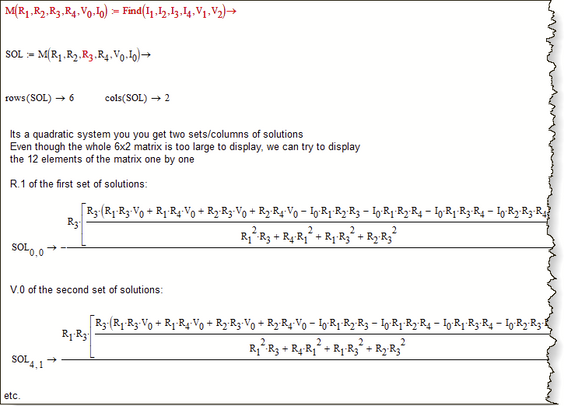
Now we arrived at a quadratic system with two sets of solutions!
Numeric evaluations shows that at least with the chosen input values all results are non-real:
- Mark as New
- Bookmark
- Subscribe
- Mute
- Subscribe to RSS Feed
- Permalink
- Notify Moderator
Not arbitrary. I have to figure out how to interpret impedance measurement data for diodes. For solar cells as well.
I have data fitted for different equivalent circuits depending of initial impedance spectra features and I hope to make use of them in terms of transforming AC impedance data into DC network and as such start it to use for physical models.
I modified your last worksheet and replaced the circuit for a most simple one usable. And this now makes sense.
I put here possible different circuits in pdf, but the one marked here in pdf as (a) I have fitted data at hand.
Do you have idea how to use my data from fitting results? These values are differential and must be integrated as functions of their appropriate currents lowing through them. These currents are jet to be found with the help of these equations.
Here only results at zero applied bias can be used straight away from the table because at this point of voltage integral resistance coincides with differential value.
How to use these fitting data now?
I imagine maybe there must be a kind of iterative calculation of results that feeds results of the previous calculation into the next calculation cycle in hope there is a kind of final convergence of calculation.
I am sorry... Can you build a kind of program cycle for me or show how to do it?
It needs a function of resistances from fitting (note these values are conductances in the table with the dimension of siemens) as their appropriate current through. For r1 (differential resistance) it must be function of I1, for r2 it must be as a function of I2. r3 has its parameter I0 available in data.
I am not sure what about the calculated V1 value. It may be a constant but this is not sure. It depends possibly on that how good is the circuit in use for this particular experiment.
So for example first calculation with differential values r as a initial quess for integral resistances R gives a set of answers. Now these answers are used for the construction of functions of differential resistances F(r1,I1) and F(r2,I2) and this goes in cycles until there is clear is there any convergence available or not.
Values in the table are r1=dV1/dI1, hence R1=(integr from 0 to I1 (F(r1,I1)dI1))/I1 and R2=(integr from 0 to I2 (F(r2,I2)dI2))/I2. For R3 it is R3=(integr from 0 to I0 (F(r3,I0)dI0))/I0 which is available from measurement data.
- Mark as New
- Bookmark
- Subscribe
- Mute
- Subscribe to RSS Feed
- Permalink
- Notify Moderator
Ah, as I understand now you are not trying to solve for a given circuit but are trying to find a circuit which could explain an effect your measurement data are showing. Tricky.
And as I understand from your last answer it seems to be going more and more complicated.
I guess that sooner or later symbolic evaluation (neither with "solve" nor evaluating the solve block "find" symbolically) will be of not much help as either the eval will fail as the symbolics is not capable enough or the results will be to big to display - even when you try to display them singly as I suggested in my previous answer.
That means that sooner or later you will have to resort to Primes numeric methods. This means that you will have to provide values for all variables beforehand and also guess values for the variables you are looking for. If a system has multiple solutions, you will always get only one of them depending on the guess values you provide.
- Mark as New
- Bookmark
- Subscribe
- Mute
- Subscribe to RSS Feed
- Permalink
- Notify Moderator
probably are on the table as those depicted on the pdf I posted. The
fitting procedure containes more parameters for capacitances, inductances,
elements not well understood as constant phase elements CPE, but here are
only these elements which remain then the frequency of measurement current
reaches it limit zero herts and as such correspond to the DC response of
the circuit.
These circuits somehow have to reflect custom physical models described in
usual textbooks of physics. And as such I have to steer my analysis in that
direction. And this is that limit together with my ability to comprehend
the situation in terms I am able my selves.
Not already able if seeking help from other people.
Of course it is tricky but as far as maybe I can rely on symbolic
solutions, it still is affordable using such programs as Mathcad.
I hope I have not lost my mind and not became too greedy to have something
which is beyond any scope. Greedy I am, this I know, but maybe this
situation can be managed in reasonable terms.
- Mark as New
- Bookmark
- Subscribe
- Mute
- Subscribe to RSS Feed
- Permalink
- Notify Moderator
You asked about how to do the fitting with the help of Mathcad but I didn't understand what kind of fit of what data you are looking for.
Lets settle with your simple circuit a)
It seems that you are looking for the best values of R1, R2, R3, V0 and I0 here?
What data would be the input data for the fit? I looked at your excel sheet but could not find any formula how to calculate the value of the Fit quality you show in this table. Furthermore I can't see anywhere the data you used for R1, R2, R3, V0 and I0 in the Mathcad sheet where you said this are manual fitted data.
- Mark as New
- Bookmark
- Subscribe
- Mute
- Subscribe to RSS Feed
- Permalink
- Notify Moderator
Yes, lets take the circuit a as an example.
In the table (excel worksheet ) R1,R2 and R3 are differential values,
unfortunately they are conductances in that table. Instead, R1 = 1/G1 then
taken from the table.
These are differential values of conductances in the table. It is better to
sign these values with small letters g1, g2 and g3. To have differential
resistances r = 1/g.
This is my fault in the table shoud be signed values as g1,g2,g3 (siemens).
They are differential values.
The equations what we just have been solved need integral R1, R2, R3.
To calculate these, differential values of resistances r1,r2,r3 (small
letters)or their inverse g1,g2,g3 can be used *IF ONE ALREADY KNOWS * values
of I1 and I2. The value of V1 is not needed.
But ... I1 and I2 are not known.
Hence ....
to calculate these I would like to try a recurrent calculation loop : I put
pdf for this. there it is easier to write the formula.
Really bad handwriting. Many mistakes. If this is impossible to read I try
to print this in word. But this I can do tomorrow morning.
- Mark as New
- Bookmark
- Subscribe
- Mute
- Subscribe to RSS Feed
- Permalink
- Notify Moderator
I may have made a mistake in typing your equations over. If not, you're looking at:
Note that the symbolic solution is huge, but not too large for Mathcad 11. I chopped it off in the second page of many...
Success!
Luc
- Mark as New
- Bookmark
- Subscribe
- Mute
- Subscribe to RSS Feed
- Permalink
- Notify Moderator
Thank you Werner and Luc!
I have to discuss with my elder colleague how to continue this project.
There are many possibilities of how to construct the circuit and possibly somewhat more general approach may be a model of a Wheatstone bridge but this is surely even more huge in solutions than these previously.
But this is only for the beginning ...,
because the data for these equations in terms of R resistances are available only in differential form and if this was not unfavorable enough in order to integrate these values to find integral R values, these differentials have to be used as functions of the branch currents what are jet to be found!
- Mark as New
- Bookmark
- Subscribe
- Mute
- Subscribe to RSS Feed
- Permalink
- Notify Moderator
Here in that worksheet are the data from manual fitting and the explanation what I would like to do with the solution obtained from the solve block together with the data in form of differentials.
- Mark as New
- Bookmark
- Subscribe
- Mute
- Subscribe to RSS Feed
- Permalink
- Notify Moderator
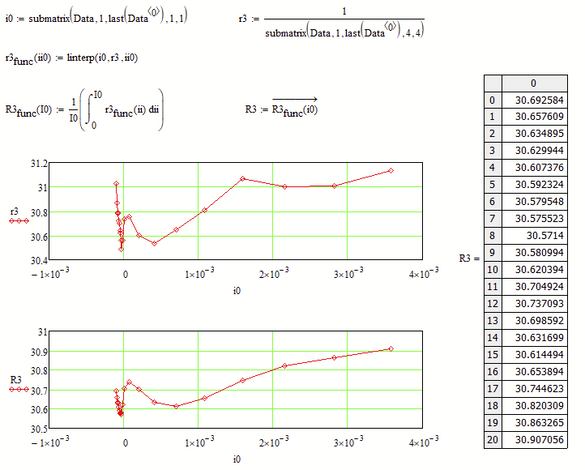
Here as a first attempt the calculation for R3. As the values of r3 seem to follow no specific function type I guessed that a simple linear interpolation would be as good as any other.
Not sure how to implement the rest - the calc loops for R1 and R2.
- Mark as New
- Bookmark
- Subscribe
- Mute
- Subscribe to RSS Feed
- Permalink
- Notify Moderator
Yes, with R3 it is right that.
From that result it shows that at least for R3 these calculated values are quite close to values of r3 found from manual fitting. The difference is probably less than 10%.
If such a situation is also for R1 and R2 these assumptions that calculations initially with r1 and r2 can give quite close answers for I1 and I2 may even hold.
But yes, this loop is something more difficult to do.
The next step would be now to calculate initial values for I1 and I2 using values of r1, r2 and R3 for R1, R2 and R3 in the Given block solution. I can try if I can do this.
- Mark as New
- Bookmark
- Subscribe
- Mute
- Subscribe to RSS Feed
- Permalink
- Notify Moderator
- Mark as New
- Bookmark
- Subscribe
- Mute
- Subscribe to RSS Feed
- Permalink
- Notify Moderator
- Mark as New
- Bookmark
- Subscribe
- Mute
- Subscribe to RSS Feed
- Permalink
- Notify Moderator
Because your variable named i is undefined. If you want it, or any function depending on it, numerically evaluated, you HAVE to make sure that i is numerically defined (has a numeric value), BEFORE you use it in a numerical evaluation.
Success!
Luc
- Mark as New
- Bookmark
- Subscribe
- Mute
- Subscribe to RSS Feed
- Permalink
- Notify Moderator
I am not sure as your calculations are now getting too complicated and time-consuming for me to think them through completely, but cold it be that you meant something like shown in the attached pic?
You sure will find a more suitable name for the function argument - I simply added "xx" to distinguish from the vector calculated before.


