
Turn on suggestions
Auto-suggest helps you quickly narrow down your search results by suggesting possible matches as you type.
Showing results for
Please log in to access translation
Turn on suggestions
Auto-suggest helps you quickly narrow down your search results by suggesting possible matches as you type.
Showing results for
Community Tip - Need to share some code when posting a question or reply? Make sure to use the "Insert code sample" menu option. Learn more! X
Translate the entire conversation x
Please log in to access translation
Options
- Subscribe to RSS Feed
- Mark Topic as New
- Mark Topic as Read
- Float this Topic for Current User
- Bookmark
- Subscribe
- Mute
- Printer Friendly Page
Hi everyone, I would like to fit my data with the function describe on the file
Feb 12, 2013
04:33 PM
- Mark as New
- Bookmark
- Subscribe
- Mute
- Subscribe to RSS Feed
- Permalink
- Notify Moderator
Please log in to access translation
Feb 12, 2013
04:33 PM
Hi everyone, I would like to fit my data with the function describe on the file
Please can you tell me what is wrong in my thinking to solve my problem. which is fit my data with the function which is describe in the file.
Thank you
Labels:
- Labels:
-
Statistics_Analysis
37 REPLIES 37
Mar 03, 2013
10:33 AM
- Mark as New
- Bookmark
- Subscribe
- Mute
- Subscribe to RSS Feed
- Permalink
- Notify Moderator
Please log in to access translation
Mar 03, 2013
10:33 AM
Again your fit function seems to be cause for the problem - are you really sure about f? I think you cannot ask for a good fit with that function. But then, I may be wrong. If that function has a specific meaning to you, you should know where to search for appropriate guess values, too.
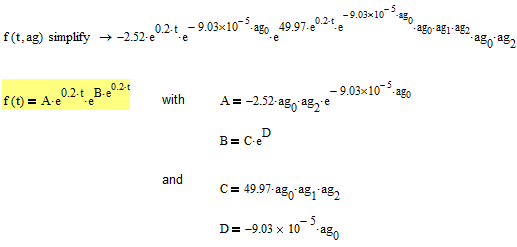
I have gone through the trouble of looking what your function f really looks like. And while it seems on first glance that you have three independent parameters to vary, on closer look we see that there are only two, none of them being a multiplicator of t, either.
Here is what you function basically looks like, below what I think it should look
Mar 04, 2013
02:04 AM
- Mark as New
- Bookmark
- Subscribe
- Mute
- Subscribe to RSS Feed
- Permalink
- Notify Moderator
Please log in to access translation
Mar 04, 2013
02:04 AM
First of all, I don't undertand why you choose to simplify the expression instead to evaluate it. what is the difference between the two operations (simplify and evaluate) and I also want to remind you that when we have used the same function previoulsly to fit the same data but the difference is that in the previous data, the data was: intensity function of time but now the that is intensity function of potential and this is why the figure turns.
I hope that now you undertand well.
Mar 04, 2013
06:04 AM
- Mark as New
- Bookmark
- Subscribe
- Mute
- Subscribe to RSS Feed
- Permalink
- Notify Moderator
Please log in to access translation
Mar 04, 2013
06:04 AM
Patrick Seumo schrieb:
First of all, I don't undertand why you choose to simplify the expression instead to evaluate it.
I just wanted to see what your function really looks as a couldn't see it from your complex definitioins with all those variables. BTW, You did that yourself. I additionally used the format result menu you reduce the numer of shown decimals. You cannot evaluate the function definition numerically as of the parameters.
remind you that when we have used the same function previoulsly to fit the same data but the difference is that in the previous data, the data was: intensity function of time but now the that is intensity function of potential and this is why the figure turns.
I hope that now you undertand well.
I remember that the first fit was average but your second example didn't find a good fit. I am not looking at what the data might represent - I am looking at the function you try the data to fit (the yellow one) and can not image to achieve a fit with it. Of course I may be wrong but then you would have to spend quite some time playing around with guess and TOL values.
Why do you think your fit function should work for the exact data you had provided? Where do you have it from? Could you check it again against the source.
Mar 03, 2013
12:45 PM
- Mark as New
- Bookmark
- Subscribe
- Mute
- Subscribe to RSS Feed
- Permalink
- Notify Moderator
Please log in to access translation
Mar 03, 2013
12:45 PM
Your function is different in each case. Tell me what this equation means, comes from thermodynamics or what?
Mar 04, 2013
01:35 AM
- Mark as New
- Bookmark
- Subscribe
- Mute
- Subscribe to RSS Feed
- Permalink
- Notify Moderator
Please log in to access translation
Mar 04, 2013
01:35 AM
this equation comes from the kinetic of electrochemical reaction at the electrode surface
Mar 04, 2013
06:27 AM
- Mark as New
- Bookmark
- Subscribe
- Mute
- Subscribe to RSS Feed
- Permalink
- Notify Moderator
Please log in to access translation
Mar 04, 2013
06:27 AM
Sure you had bad model equation. Check them carefully again. Because now when this equation can not be extrapolated.
Sorry bad english
Mar 04, 2013
09:44 AM
- Mark as New
- Bookmark
- Subscribe
- Mute
- Subscribe to RSS Feed
- Permalink
- Notify Moderator
Please log in to access translation
Mar 04, 2013
09:44 AM
Jan Kowalski schrieb:
Sure you had bad model equation.
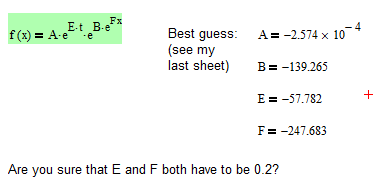
I second that! The variable t exists only two times in an expression exp(0.2*t). Ther should be a variable (and to be fitted) factor here to allow for scaling in absicissa direction.
Mar 04, 2013
11:51 AM
- Mark as New
- Bookmark
- Subscribe
- Mute
- Subscribe to RSS Feed
- Permalink
- Notify Moderator
Please log in to access translation
Mar 04, 2013
11:51 AM
Patrick Seumo schrieb:
this equation comes from the kinetic of electrochemical reaction at the electrode surface
I urge you to check it again and to look if it really should apply to the specific data you are trying to fit.
Two other points which may help, as soon as you had found a correct and suitable function for f, are to decrease the value of TOL (your I-values are very small, so genfit could give up too soon) and maybe to throw away data which does not account for the region of the curve you are interested in. In your case I could imagine to restrict the data to values of V from 0 to 0.1. How to do that you can see in the accompanied sheet. Still with the bad function f you don't get a better fit.
- « Previous
-
- 1
- 2
- Next »


