
Turn on suggestions
Auto-suggest helps you quickly narrow down your search results by suggesting possible matches as you type.
Showing results for
Please log in to access translation
Turn on suggestions
Auto-suggest helps you quickly narrow down your search results by suggesting possible matches as you type.
Showing results for
Community Tip - Learn all about PTC Community Badges. Engage with PTC and see how many you can earn! X
Translate the entire conversation x
Please log in to access translation
Options
- Subscribe to RSS Feed
- Mark Topic as New
- Mark Topic as Read
- Float this Topic for Current User
- Bookmark
- Subscribe
- Mute
- Printer Friendly Page
How to plot a single element in a matrix vs. a variable?
Feb 21, 2015
01:11 PM
- Mark as New
- Bookmark
- Subscribe
- Mute
- Subscribe to RSS Feed
- Permalink
- Notify Moderator
Please log in to access translation
Feb 21, 2015
01:11 PM
How to plot a single element in a matrix vs. a variable?
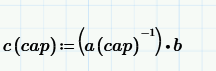
I'm trying to plot c(0,1) vs cap
2 REPLIES 2
Feb 21, 2015
02:23 PM
- Mark as New
- Bookmark
- Subscribe
- Mute
- Subscribe to RSS Feed
- Permalink
- Notify Moderator
Please log in to access translation
Feb 21, 2015
02:23 PM
c is defined as a function with just one argument, so you cannot call it with two arguments (0,1).
Its not clear to me what you are trying to do.
Maybe a good idea to give further informations and attach your worksheet.
Feb 23, 2015
06:50 AM
- Mark as New
- Bookmark
- Subscribe
- Mute
- Subscribe to RSS Feed
- Permalink
- Notify Moderator
Please log in to access translation
Feb 23, 2015
06:50 AM
I agree, it's not clear. Maybe the attached will help.


