Community Tip - Need to share some code when posting a question or reply? Make sure to use the "Insert code sample" menu option. Learn more! X
- Subscribe to RSS Feed
- Mark Topic as New
- Mark Topic as Read
- Float this Topic for Current User
- Bookmark
- Subscribe
- Mute
- Printer Friendly Page
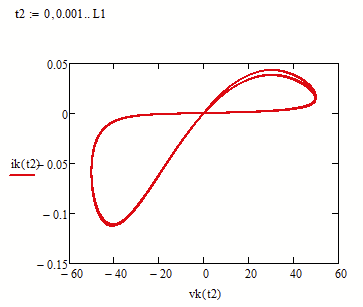
I am getting multiple overlapped plot while plotting for vk(t) vs ik(t)
- Mark as New
- Bookmark
- Subscribe
- Mute
- Subscribe to RSS Feed
- Permalink
- Notify Moderator
I am getting multiple overlapped plot while plotting for vk(t) vs ik(t)
Dear All,
I was trying to plot vk(t) vs ik(t). I am supposed to get only single plot for vk(t) vs ik(t).
I am getting multiple overlapped plot while plotting for vk(t) vs ik(t).
The mathcad code is attached below.
My interest is, I need to only one plot for vk(t) vs ik(t).
Could anyone rectify this problem. (I am using Mathcad 15 software)
Thanks in advance
Solved! Go to Solution.
Accepted Solutions
- Mark as New
- Bookmark
- Subscribe
- Mute
- Subscribe to RSS Feed
- Permalink
- Notify Moderator
- Mark as New
- Bookmark
- Subscribe
- Mute
- Subscribe to RSS Feed
- Permalink
- Notify Moderator
Increase the numberof t2.
- Mark as New
- Bookmark
- Subscribe
- Mute
- Subscribe to RSS Feed
- Permalink
- Notify Moderator
- Mark as New
- Bookmark
- Subscribe
- Mute
- Subscribe to RSS Feed
- Permalink
- Notify Moderator
Sometimes (not always) its a good idea to use Mathcads Quickplot feature and let it chose the step width automatically:
tt is not defined anywhere.
Is there a reason for the strange stepwith 1/w you defined and why you don't start the parameter at zero?
Your sine vk has a period of somewhat lower than 10, so when you run t from 0 to L1 (approx. 200) then you are looping through your "8"-curve 20 times.
Your range t2 starts from approx 150 so the curve still is looped through 5 times. This and the fact that you had chosen a large stepwidth and because Mathcad connects the points calculated by straight lines created the effect you saw.
- Mark as New
- Bookmark
- Subscribe
- Mute
- Subscribe to RSS Feed
- Permalink
- Notify Moderator
Thanks for your valuable comments.
And your plot vk(tt) and ik(tt). It is defined anywhere in the prograrm, does mathcad will consider tt as automatically.
I have used 1/w to mention the frequency.


