Community Tip - You can change your system assigned username to something more personal in your community settings. X
- Subscribe to RSS Feed
- Mark Topic as New
- Mark Topic as Read
- Float this Topic for Current User
- Bookmark
- Subscribe
- Mute
- Printer Friendly Page
Mathcad Prime - Breaks in Integral Graph Causing Problems
- Mark as New
- Bookmark
- Subscribe
- Mute
- Subscribe to RSS Feed
- Permalink
- Notify Moderator
Mathcad Prime - Breaks in Integral Graph Causing Problems
Hello everyone.
I'm trying to make a spreadsheet that graphs partial uniform loads and seem to have run into an issue. It all works for the most part. However, when trying to graph, the graph typically "fails" in certain places. See my attached file and notice the missing portion of the graph at x=8.4ft.
Is there any way to fix this?
Note that I've already tried messing with the TOL global variable to no avail. It usually causes the break to move to a different place in the graph and doesn't actually fix anything. If it does fix it then it is usually just for that one case and if you put in different loads/locations it'll break again. What should I do?
Solved! Go to Solution.
- Labels:
-
Mathcad Usage
Accepted Solutions
- Mark as New
- Bookmark
- Subscribe
- Mute
- Subscribe to RSS Feed
- Permalink
- Notify Moderator
I opened your sheet with Prime 6 and can confirm that the function returns an error for x=8.4 ft and that changing the TOL value does not solve the problem.
Slightly changing the value of x.A (to 2.0001 ft) "solved" the problem.
If its just a cosmetic problem and you are only concerned because of the gap in the plot, you may simply use a slightly different range for x when you plot, something like x:=0 ft, 0,11 ft .. L or x:=0 ft, 0,099 ft .. L works pretty well but the last value for x will be smaller than L (10 ft) and so you may want to let the range run up to L+0.1ft.
Your function M uses an integral which in turn calls another function also using an integral. So quite a lot of integrals have to be calculated for the plot and you can see that creating the plot quite takes some time.
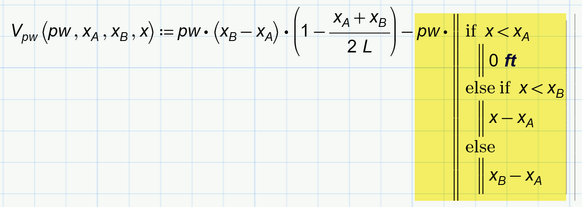
Here is a more efficient way by defining function V without an integral:
Calculation now is lightning fast, the results are more precise even without using a smaller TOL value and the problem with x=8.4 ft is also gone away -> win-win-win 🙂
Of course you could also use the if-function
or the program if
if you feel thats better readable. All three version are fast, provide better precision and do not suffer from the 8,4 ft problem.
- Mark as New
- Bookmark
- Subscribe
- Mute
- Subscribe to RSS Feed
- Permalink
- Notify Moderator
In version 7.0, everything is displayed normally on the plot:
What version of Mathcad Prime are you using?
- Mark as New
- Bookmark
- Subscribe
- Mute
- Subscribe to RSS Feed
- Permalink
- Notify Moderator
Prime7 TOL=10^-3
TOL=10^-1
- Mark as New
- Bookmark
- Subscribe
- Mute
- Subscribe to RSS Feed
- Permalink
- Notify Moderator
I’m on version 3. I guess that’s why. It’s just weird that the whole graph would work fine except one number.
- Mark as New
- Bookmark
- Subscribe
- Mute
- Subscribe to RSS Feed
- Permalink
- Notify Moderator
Tested in Mathcad Prime 3, result (in both cases, I did not change the calculation tolerance, just recalculated the entire worksheet):
By the way, if you want to try the Mathcad Prime 7 version, here are the links:
https://www.mathcad.com/en/try-and-buy/mathcad-express-free-download/install
- Mark as New
- Bookmark
- Subscribe
- Mute
- Subscribe to RSS Feed
- Permalink
- Notify Moderator
I opened your sheet with Prime 6 and can confirm that the function returns an error for x=8.4 ft and that changing the TOL value does not solve the problem.
Slightly changing the value of x.A (to 2.0001 ft) "solved" the problem.
If its just a cosmetic problem and you are only concerned because of the gap in the plot, you may simply use a slightly different range for x when you plot, something like x:=0 ft, 0,11 ft .. L or x:=0 ft, 0,099 ft .. L works pretty well but the last value for x will be smaller than L (10 ft) and so you may want to let the range run up to L+0.1ft.
Your function M uses an integral which in turn calls another function also using an integral. So quite a lot of integrals have to be calculated for the plot and you can see that creating the plot quite takes some time.
Here is a more efficient way by defining function V without an integral:
Calculation now is lightning fast, the results are more precise even without using a smaller TOL value and the problem with x=8.4 ft is also gone away -> win-win-win 🙂
Of course you could also use the if-function
or the program if
if you feel thats better readable. All three version are fast, provide better precision and do not suffer from the 8,4 ft problem.
- Mark as New
- Bookmark
- Subscribe
- Mute
- Subscribe to RSS Feed
- Permalink
- Notify Moderator
Hi,
To finish with the superposition of the vectors pw, xA, and xB.
Cheers
Terry
- Mark as New
- Bookmark
- Subscribe
- Mute
- Subscribe to RSS Feed
- Permalink
- Notify Moderator
Thank you for the replies everyone. Much appreciated! The replace the integral with a formula works much better than what I had originally.


