Community Tip - Need to share some code when posting a question or reply? Make sure to use the "Insert code sample" menu option. Learn more! X
- Subscribe to RSS Feed
- Mark Topic as New
- Mark Topic as Read
- Float this Topic for Current User
- Bookmark
- Subscribe
- Mute
- Printer Friendly Page
Need help regarding regression analysis
- Mark as New
- Bookmark
- Subscribe
- Mute
- Subscribe to RSS Feed
- Permalink
- Notify Moderator
Need help regarding regression analysis
Hi everyone,
I m working on a small project. I’m trying to determine rainfall intensity using 3rd degree polynomial equation and regression analysis on MathCAD prime 8.0. If anyone can help me out I will be really thankful.
I am attaching a word file for reference.
Solved! Go to Solution.
- Labels:
-
Physics
Accepted Solutions
- Mark as New
- Bookmark
- Subscribe
- Mute
- Subscribe to RSS Feed
- Permalink
- Notify Moderator
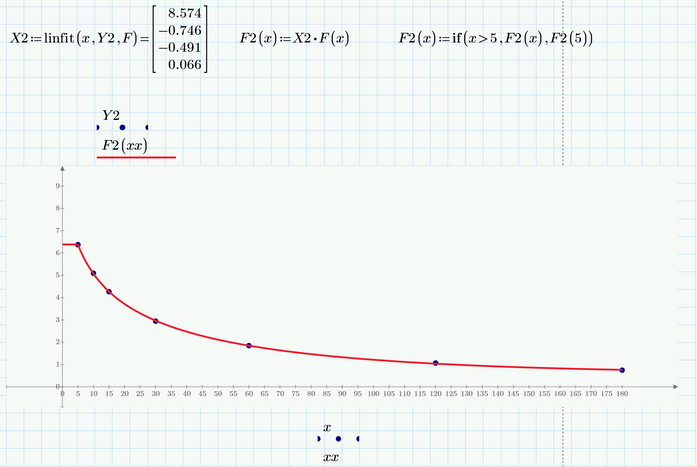
You correctly calculated the coefficients for the third order polynomials in ln(x), but you never used them!
You can define a function as seen in the pic below. Furthermore I used the if-function to force the horizontal line for the first five minutes as seen in he Word document.
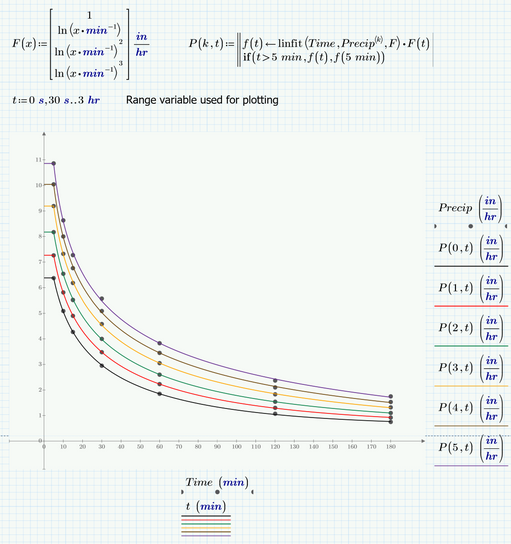
Of course you can do so for all six functions and plot them all in one plot.
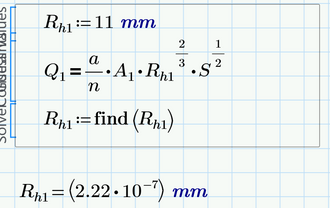
As for R.h1 - both ways you tried are correct apart from using the wrong "=" in the solve block. You have to use the Boolean / comparison = and not the assignment ":=".
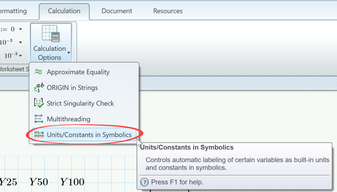
The use of the symbolic "solve" command fails, because the third party symbolic is not as good integrated into Prime as we would wish. The symbolics does not know anything about units and you can see in the result that units are not labelled correctly - thy should be bold and blue but as can be seen they are black (variables). If you try to evaluate that expression by following the symbolic evaluation with a numeric evaluation ("=") you get an error, because the numerics does not know the variables (which actually should be units). There is a calculation option you should turn on:
Sometimes it helps, but in your case it doesn't.
EDIT: Looks I made a mistake in the first place when I tried. Now that I turned on this option once again for the screenshot, assigning the result to a variable and numerically evaluating it worked OK. So turning on this option seems to have done the job,
Nevertheless its usually not that good an idea to use symbolics when you actually are not looking for a symbolic result but just for a numeric value.
So using the solve block sure should be an option. What you did wrong was using the wrong "equal" as described above and the second error was that you did not provide a correct unit for the guess value.
Another option (my preferred one) is to use the "root" function.
You can do this by providing a guess value
Oooops, unfortunately we get a tiny imaginary part which should not be there. We could cope with it by just taking the absolute value or just the real part.
Using the root-function by providing a range within the solution should be looked for seems to make a better job:
As I was using Prime 9 I don't attach the file as you would not be able to open it with P8.
But I guess that the pictures would suffice.
EDIT: Turned the sheet into Prime 6 format so you should be able to open it.
The symbolics used in Prime 6 is the same as in Prime 9, but nonetheless the result is different as P6 would return two solutions which differ in the sign.
Furthermore the symboilcs in P6 does not has the labelling problem I experienced even it the aforementioned option is not turned on.
I used a shorter (but a lot more inefficient) approach to do the plots:
- Mark as New
- Bookmark
- Subscribe
- Mute
- Subscribe to RSS Feed
- Permalink
- Notify Moderator
You definitely should attach your Mathcad or Prime worksheet to show what you have done so far, what you are trying to achieve and where yo got stuck.
- Mark as New
- Bookmark
- Subscribe
- Mute
- Subscribe to RSS Feed
- Permalink
- Notify Moderator
Thank you Werner_E for your quick response. Here is a MathCAD Prime 8.0 file. As the document says find the R2 value and trendline expression corresponding to each return period. I don't know if the graphs that I have developed in the Mathcad file are correct or not also from where I get the R2 value. Sorry if this is a very basic thing as I am new to using Mathcad. Basically, I'm stuck from points 3 to 5.
- Mark as New
- Bookmark
- Subscribe
- Mute
- Subscribe to RSS Feed
- Permalink
- Notify Moderator
You correctly calculated the coefficients for the third order polynomials in ln(x), but you never used them!
You can define a function as seen in the pic below. Furthermore I used the if-function to force the horizontal line for the first five minutes as seen in he Word document.
Of course you can do so for all six functions and plot them all in one plot.
As for R.h1 - both ways you tried are correct apart from using the wrong "=" in the solve block. You have to use the Boolean / comparison = and not the assignment ":=".
The use of the symbolic "solve" command fails, because the third party symbolic is not as good integrated into Prime as we would wish. The symbolics does not know anything about units and you can see in the result that units are not labelled correctly - thy should be bold and blue but as can be seen they are black (variables). If you try to evaluate that expression by following the symbolic evaluation with a numeric evaluation ("=") you get an error, because the numerics does not know the variables (which actually should be units). There is a calculation option you should turn on:
Sometimes it helps, but in your case it doesn't.
EDIT: Looks I made a mistake in the first place when I tried. Now that I turned on this option once again for the screenshot, assigning the result to a variable and numerically evaluating it worked OK. So turning on this option seems to have done the job,
Nevertheless its usually not that good an idea to use symbolics when you actually are not looking for a symbolic result but just for a numeric value.
So using the solve block sure should be an option. What you did wrong was using the wrong "equal" as described above and the second error was that you did not provide a correct unit for the guess value.
Another option (my preferred one) is to use the "root" function.
You can do this by providing a guess value
Oooops, unfortunately we get a tiny imaginary part which should not be there. We could cope with it by just taking the absolute value or just the real part.
Using the root-function by providing a range within the solution should be looked for seems to make a better job:
As I was using Prime 9 I don't attach the file as you would not be able to open it with P8.
But I guess that the pictures would suffice.
EDIT: Turned the sheet into Prime 6 format so you should be able to open it.
The symbolics used in Prime 6 is the same as in Prime 9, but nonetheless the result is different as P6 would return two solutions which differ in the sign.
Furthermore the symboilcs in P6 does not has the labelling problem I experienced even it the aforementioned option is not turned on.
I used a shorter (but a lot more inefficient) approach to do the plots:
- Mark as New
- Bookmark
- Subscribe
- Mute
- Subscribe to RSS Feed
- Permalink
- Notify Moderator
Thank you so much Werner_E, I m learning a lot from this.
- Mark as New
- Bookmark
- Subscribe
- Mute
- Subscribe to RSS Feed
- Permalink
- Notify Moderator
In addition to what Werner showed, you can also first symbolically solve the equation, and then provide the numerical data, as in:
Especially if you have a number of cases where there are only differences in values of a, A1, n, Q1 and/or S, just plug in the right values.
Success!
Luc


