Community Tip - Need to share some code when posting a question or reply? Make sure to use the "Insert code sample" menu option. Learn more! X
- Subscribe to RSS Feed
- Mark Topic as New
- Mark Topic as Read
- Float this Topic for Current User
- Bookmark
- Subscribe
- Mute
- Printer Friendly Page
Only outputting single point when trying to plot a function
- Mark as New
- Bookmark
- Subscribe
- Mute
- Subscribe to RSS Feed
- Permalink
- Notify Moderator
Only outputting single point when trying to plot a function
Heya, I've been looking everywhere, I've been following basic plotting tutorials, but I cannot for the life of me find a way to plot my function. Each time I try I just get a single point on the y-axis. Any help would be incredibly appreciated.
Solved! Go to Solution.
Accepted Solutions
- Mark as New
- Bookmark
- Subscribe
- Mute
- Subscribe to RSS Feed
- Permalink
- Notify Moderator
@WP_10142165 wrote:
Heya, I've been looking everywhere, I've been following basic plotting tutorials, but I cannot for the life of me find a way to plot my function. Each time I try I just get a single point on the y-axis. Any help would be incredibly appreciated.
If you put an evaluation operator at the end of a definition involving a range variable, Mathcad has a (nasty/useful) trick of converting the range to a vector. There are some who find this a useful thing as a means of creating vectors. I generally avoid the practice like the plague as it can catch even the experienced out and, apart from vectors, the output can bear little resemblance to what's stored in the defined variable.
BTW, it's good practice to post your worksheet when asking for assistance with problems. Sometimes, the source of the problem can be difficult to pin down without having the worksheet to look at (constant/variable definitions are a good example!). 🙂
Stuart
- Mark as New
- Bookmark
- Subscribe
- Mute
- Subscribe to RSS Feed
- Permalink
- Notify Moderator
@StuartBruff wrote:
If you put an evaluation operator at the end of a definition involving a range variable, Mathcad has a (nasty/useful) trick of converting the range to a vector.
Forgot to add ...
The reason you are seeing a single point is that squaring a vector returns its dot product (single value). If you want to use vectors, it's generally a good idea to check the numeric values and use the vectorize operator to apply functions/expressions to each element of a vector (or matrix).
Stuart
- Mark as New
- Bookmark
- Subscribe
- Mute
- Subscribe to RSS Feed
- Permalink
- Notify Moderator
Thank you so much! That's great to know. About adding the worksheet, I was fairly certain I attached it to the main post. Is there a better way to share it?
- Mark as New
- Bookmark
- Subscribe
- Mute
- Subscribe to RSS Feed
- Permalink
- Notify Moderator
@WP_10142165 wrote:
Thank you so much! That's great to know. About adding the worksheet, I was fairly certain I attached it to the main post. Is there a better way to share it?
It looks like you did add it - I can see it now. I sometimes suspect that there can be a bit of a delay between items appearing after posting/loading. Either that or I *really* do need to get my eyes/brain checked again! 🤓
Stuart
- Mark as New
- Bookmark
- Subscribe
- Mute
- Subscribe to RSS Feed
- Permalink
- Notify Moderator
Yes, you did attach the worksheet, Nothing wrong in doing so.
Probably the attached sheet was virus checked and so the attachment may show up a little later than the body of the post.
I am not sure about that, but it could be an explanation why Stuart saw now attachment in first place.
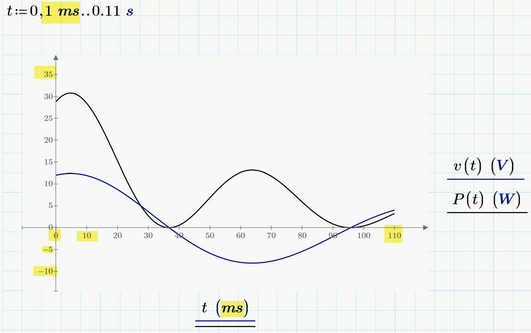
BTW, you sure want a range variable with a smaller step width and you also may consider manually changing the axis values as Primes automatic usually does a quite bad job here.
You can edit the first, second and last value on each axis
- Mark as New
- Bookmark
- Subscribe
- Mute
- Subscribe to RSS Feed
- Permalink
- Notify Moderator
Thanks for the tip, you're right, ms does seem to be the better choice, and decreasing the step makes a huge difference.
Thanks!


