Community Tip - Did you get an answer that solved your problem? Please mark it as an Accepted Solution so others with the same problem can find the answer easily. X
- Subscribe to RSS Feed
- Mark Topic as New
- Mark Topic as Read
- Float this Topic for Current User
- Bookmark
- Subscribe
- Mute
- Printer Friendly Page
Plot values on scale
- Mark as New
- Bookmark
- Subscribe
- Mute
- Subscribe to RSS Feed
- Permalink
- Notify Moderator
Plot values on scale
I want to have the plot values on scale directly and not modify the scale within plot is it possible in 15?
Solved! Go to Solution.
- Labels:
-
Mathcad Usage
Accepted Solutions
- Mark as New
- Bookmark
- Subscribe
- Mute
- Subscribe to RSS Feed
- Permalink
- Notify Moderator
OK, I see the problem but unfortunately because of a bug in Mathcads 3D component I can't offer a satisfying solution.
When you calculate Z and later plot it, all information about the original values X and Y is lost, so the best Mathcad can do is to use the matrix indices.
The usually preferred way is to plot a function. And using "CreateMesh" gives you better control than plotting the function directly.
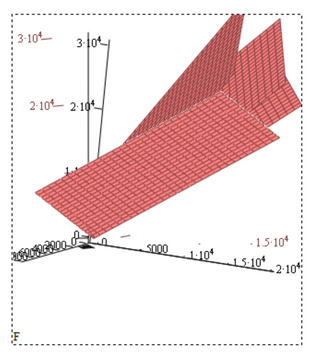
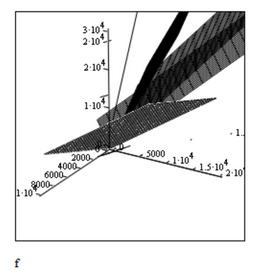
But because the 3D plot is buggy (maybe it does not like large values for x and y ?) we see some nasty artefacts.
Actually on my screen it looks even worse:
I don't know how to fix this - maybe someone else has some ideas on this.
Maybe its just the installation on my machine, so try the attached file yourself.
I also tried to plot the function directly
Look good, but Mathcad had automatically chosen the default values for x and y running from -5 to 5.
We can change this in the "3-D Plot Format" menu
and when I do this, I see this
So give it a try yourself - maybe its just my graphics driver, graphics card, OS, ....?
- Mark as New
- Bookmark
- Subscribe
- Mute
- Subscribe to RSS Feed
- Permalink
- Notify Moderator
@FC_10037391 wrote:
I want to have the plot values on scale directly and not modify the scale within plot is it possible in 15?
Please be more specific about what you would like to accomplish.
Actually I have no idea what you may be talking about.
- Mark as New
- Bookmark
- Subscribe
- Mute
- Subscribe to RSS Feed
- Permalink
- Notify Moderator
I guess you want to change axis settings without going "into" the graph. See here a Mathcad 15 file.
- Mark as New
- Bookmark
- Subscribe
- Mute
- Subscribe to RSS Feed
- Permalink
- Notify Moderator
I wanted to have scatter plot to show X and Y values that correspond to variable they represent and not indices. I am looking the type of values changes and not indices
- Mark as New
- Bookmark
- Subscribe
- Mute
- Subscribe to RSS Feed
- Permalink
- Notify Moderator
OK, I see the problem but unfortunately because of a bug in Mathcads 3D component I can't offer a satisfying solution.
When you calculate Z and later plot it, all information about the original values X and Y is lost, so the best Mathcad can do is to use the matrix indices.
The usually preferred way is to plot a function. And using "CreateMesh" gives you better control than plotting the function directly.
But because the 3D plot is buggy (maybe it does not like large values for x and y ?) we see some nasty artefacts.
Actually on my screen it looks even worse:
I don't know how to fix this - maybe someone else has some ideas on this.
Maybe its just the installation on my machine, so try the attached file yourself.
I also tried to plot the function directly
Look good, but Mathcad had automatically chosen the default values for x and y running from -5 to 5.
We can change this in the "3-D Plot Format" menu
and when I do this, I see this
So give it a try yourself - maybe its just my graphics driver, graphics card, OS, ....?
- Mark as New
- Bookmark
- Subscribe
- Mute
- Subscribe to RSS Feed
- Permalink
- Notify Moderator
This looks great, thank you so much i think the higher value is causing the streak to pop out within plot it that so? Because when the values are lowered it does not seem to create that annoying line in plot
- Mark as New
- Bookmark
- Subscribe
- Mute
- Subscribe to RSS Feed
- Permalink
- Notify Moderator
So you say that its not just on my side but that you experience that bug as well?
Not sure what exactly causes it - it may be the high values and I noticed, too, that when the function values are divided by something like 10^4 the bug does not show up.
Its sure a bug as it should work, but nobody will fix a bug in MC15 anymore 😞


