
Turn on suggestions
Auto-suggest helps you quickly narrow down your search results by suggesting possible matches as you type.
Showing results for
Please log in to access translation
Turn on suggestions
Auto-suggest helps you quickly narrow down your search results by suggesting possible matches as you type.
Showing results for
Community Tip - Did you get an answer that solved your problem? Please mark it as an Accepted Solution so others with the same problem can find the answer easily. X
Translate the entire conversation x
Please log in to access translation
Options
- Subscribe to RSS Feed
- Mark Topic as New
- Mark Topic as Read
- Float this Topic for Current User
- Bookmark
- Subscribe
- Mute
- Printer Friendly Page
Plot won't evaluate unless a calculated function explictly defined
Apr 16, 2012
10:53 AM
- Mark as New
- Bookmark
- Subscribe
- Mute
- Subscribe to RSS Feed
- Permalink
- Notify Moderator
Please log in to access translation
Apr 16, 2012
10:53 AM
Plot won't evaluate unless a calculated function explictly defined
Hello,
Please see the attached MCAD worksheet.
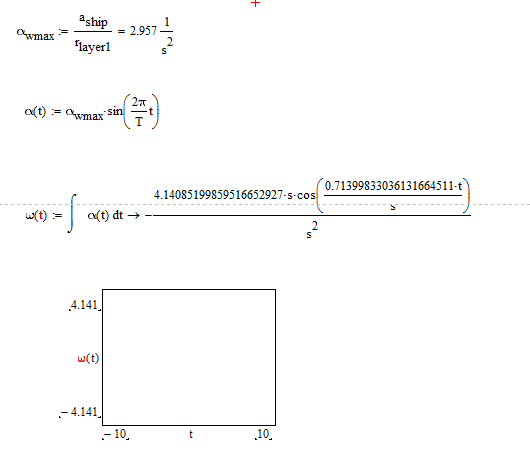
The function alpha (t) has a variable alpha max that is previously defined. Alpha max carries units with it and those units appear correct. In the sheet I can only get the plot for omega to work by manually setting Alpha max to a value with the correct units (1/s^2).
I cannot figure out why the program is doing this. If anybody can assist that would be greatly appreciated!
Thank you,
Mike
Labels:
- Labels:
-
Physics
10 REPLIES 10
Apr 16, 2012
11:30 AM
- Mark as New
- Bookmark
- Subscribe
- Mute
- Subscribe to RSS Feed
- Permalink
- Notify Moderator
Please log in to access translation
Apr 16, 2012
11:30 AM
The symbolic solver doesn't like units. I suggest you tackle the problem as in the attached.
Alan
Apr 16, 2012
12:47 PM
- Mark as New
- Bookmark
- Subscribe
- Mute
- Subscribe to RSS Feed
- Permalink
- Notify Moderator
Please log in to access translation
Apr 16, 2012
12:47 PM
Thanks Alan. I see. I can get it to run if I do those substitions. I can also get it to run if I make it dependent on T. I would like to not have to do this so I can see the explicit values of the evaluated function without the variables in them.
Apr 16, 2012
01:14 PM
- Mark as New
- Bookmark
- Subscribe
- Mute
- Subscribe to RSS Feed
- Permalink
- Notify Moderator
Please log in to access translation
Apr 16, 2012
01:14 PM
Michael Einhorn wrote:
Thanks Alan. I see. I can get it to run if I do those substitions. I can also get it to run if I make it dependent on T. I would like to not have to do this so I can see the explicit values of the evaluated function without the variables in them.
I guess Wayne is using M15 (M010). Looks like you will have to upgrade to that if you want to see the explicit values all the time!
Alan
Apr 16, 2012
01:15 PM
- Mark as New
- Bookmark
- Subscribe
- Mute
- Subscribe to RSS Feed
- Permalink
- Notify Moderator
Please log in to access translation
Apr 16, 2012
01:15 PM
Yes, I am using M010
Apr 16, 2012
12:41 PM
- Mark as New
- Bookmark
- Subscribe
- Mute
- Subscribe to RSS Feed
- Permalink
- Notify Moderator
Please log in to access translation
Apr 16, 2012
12:41 PM
Am I missing something?
It works for me (M15)
Apr 16, 2012
12:47 PM
- Mark as New
- Bookmark
- Subscribe
- Mute
- Subscribe to RSS Feed
- Permalink
- Notify Moderator
Please log in to access translation
Apr 16, 2012
12:47 PM
Hello Wayne,
I am running M14...I wonder if that is the issue?
Apr 16, 2012
12:58 PM
- Mark as New
- Bookmark
- Subscribe
- Mute
- Subscribe to RSS Feed
- Permalink
- Notify Moderator
Please log in to access translation
Apr 16, 2012
12:58 PM
Interesting! This is what I get in M15 (F000):
There is a small difference in the way the solution is expressed. My modified approach gives:
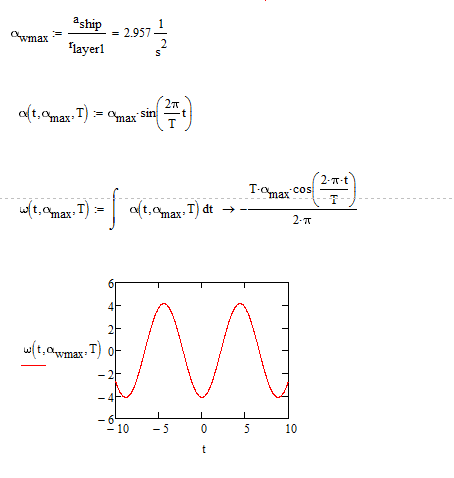
Looks like the only difference in the graph is due to the different range for t.
Alan
Apr 16, 2012
01:14 PM
- Mark as New
- Bookmark
- Subscribe
- Mute
- Subscribe to RSS Feed
- Permalink
- Notify Moderator
Please log in to access translation
Apr 16, 2012
01:14 PM
I get the same, I just changed the range because the prior graph started at t=0. But I could plot -10 to 10 as well.
Attached sheet with active graph and a picture of the graph I get?
Apr 16, 2012
01:18 PM
- Mark as New
- Bookmark
- Subscribe
- Mute
- Subscribe to RSS Feed
- Permalink
- Notify Moderator
Please log in to access translation
Apr 16, 2012
01:18 PM
Wayne Reid wrote:
I get the same, I just changed the range because the prior graph started at t=0. But I could plot -10 to 10 as well.
Attached sheet with active graph and a picture of the graph I get?
Your sheet gives the error in my version of M15 also. You must be using the updated version.
Alan
Apr 17, 2012
07:35 PM
- Mark as New
- Bookmark
- Subscribe
- Mute
- Subscribe to RSS Feed
- Permalink
- Notify Moderator
Please log in to access translation
Apr 17, 2012
07:35 PM
All, I just installed M15 Date code M010 and that fixed the issue.
Thanks!
Mike


