Community Tip - You can change your system assigned username to something more personal in your community settings. X
- Subscribe to RSS Feed
- Mark Topic as New
- Mark Topic as Read
- Float this Topic for Current User
- Bookmark
- Subscribe
- Mute
- Printer Friendly Page
Ploting an elliptical curve
- Mark as New
- Bookmark
- Subscribe
- Mute
- Subscribe to RSS Feed
- Permalink
- Notify Moderator
Ploting an elliptical curve
Hello everyone,
Sorry if it has ever been answered before. I have tried to find the solution but I have not been able to solve it.
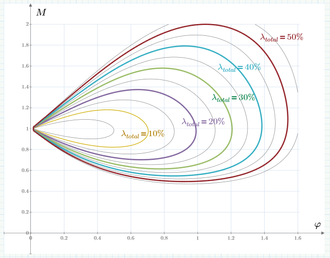
I would like to plot an equation (in prime 4.0) with a shape similar to an ellipse.
In the end I should get different shapes for different lambda values.
Thank you!
Sergio.
Solved! Go to Solution.
- Labels:
-
Mathcad Usage
Accepted Solutions
- Mark as New
- Bookmark
- Subscribe
- Mute
- Subscribe to RSS Feed
- Permalink
- Notify Moderator
- Mark as New
- Bookmark
- Subscribe
- Mute
- Subscribe to RSS Feed
- Permalink
- Notify Moderator
Hi,
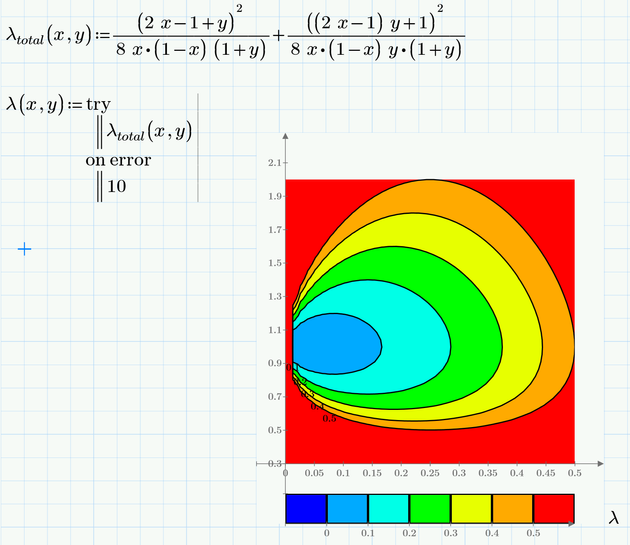
you could do so:
a more complete chart is as follows:
- Mark as New
- Bookmark
- Subscribe
- Mute
- Subscribe to RSS Feed
- Permalink
- Notify Moderator
Prime does not support implicit plots, but you could use a contour plot.
You must type multiplication signs between a variable an a parenthesis as otherwise Prime assumes you are typing a function.
- Mark as New
- Bookmark
- Subscribe
- Mute
- Subscribe to RSS Feed
- Permalink
- Notify Moderator
As a follow-on from Werner's, here's a CreateMesh option. Using high enough mesh density the colors vanish (I assume because mathcad gets confused at the convergence point) but a possible advantage for you. MF's solution works also but you'll get some gaps on the right end of the ellipse at times.
- Mark as New
- Bookmark
- Subscribe
- Mute
- Subscribe to RSS Feed
- Permalink
- Notify Moderator
@DJF wrote:
As a follow-on from Werner's, here's a CreateMesh option. Using high enough mesh density the colors vanish (I assume because mathcad gets confused at the convergence point)
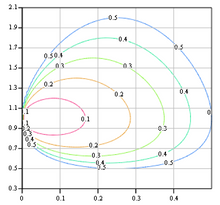
Normally the mesh density does not has much effect on the colors but in this case it obviusly has. Funny effect for a mesh size of 80 to 90. Alas, its Prime. Mathcad wasn't perfect in no way but we still had more way to infuence the plot (like number of iso lines, see the pic) but 3D-plots in Prime really suck.
- Mark as New
- Bookmark
- Subscribe
- Mute
- Subscribe to RSS Feed
- Permalink
- Notify Moderator
- Mark as New
- Bookmark
- Subscribe
- Mute
- Subscribe to RSS Feed
- Permalink
- Notify Moderator
Solution without animation is not solution!
- Mark as New
- Bookmark
- Subscribe
- Mute
- Subscribe to RSS Feed
- Permalink
- Notify Moderator
Who claims that Mathcad can't do implicit plots?
Thanks to Viacheslav N. Mezentsev even Prime can do it 😉
- Mark as New
- Bookmark
- Subscribe
- Mute
- Subscribe to RSS Feed
- Permalink
- Notify Moderator
Can anyone explain how Mathcad is able to plot this implicit (ala Werner via Mezentsev) graph? The data isn't sequential yet we get a smooth curve plotted. (I had some crazy thoughts of fitting some b-splines to it, but hit some immediate snags given the format)
- Mark as New
- Bookmark
- Subscribe
- Mute
- Subscribe to RSS Feed
- Permalink
- Notify Moderator
Looks like Viacheslav uses 1j instead of NaN to separate the various line segments. So the "curve" you see consist just of a number of line segments which are not drawn in consecutive order.
Those segments are not in order but as a whole make up for the complete curve (which sometimes sure has some "holes". If you want to apply a fit you would first to have to get rid of the 1j's and sort the various line segments.
I never took the time to make a more intense look into his routine - just was impressed that its possible to do with reasonable speed.
Also impressive is his implicit3D.
- Mark as New
- Bookmark
- Subscribe
- Mute
- Subscribe to RSS Feed
- Permalink
- Notify Moderator
- Mark as New
- Bookmark
- Subscribe
- Mute
- Subscribe to RSS Feed
- Permalink
- Notify Moderator
Hmmm, thats the usual brute force way to plot an implicit function. In contrast to the elegant and ingenious implicit2D method of uno, this way is very time consuming and the result is just a bunch of unsorted points. I don't see how this would help fitting some B-splines, which was DJF's goal.
Using uno's function this might be possible, but I guess the the line segments produced by his function might also duplicate or overlap o have "holes", making sorting them quite difficult, maybe impossible.
- Mark as New
- Bookmark
- Subscribe
- Mute
- Subscribe to RSS Feed
- Permalink
- Notify Moderator
@ValeryOchkov wrote:
@DJF wrote:
Can anyone explain how Mathcad is able to plot this implicit graph?
KISS - Keep It simple, Stupid!
We can plot 2D and 3D implicit curves by help simple scanning! (Or useing Maple!)
And solve others not simple problem - this for example:
How? See the picture 3 here
Sorry - the Mathcad 15 sheet in attach.
It is very interesting problem: it's symbolic solution get us not correct answer in Mathcad? Maple and Mathematica!
- Mark as New
- Bookmark
- Subscribe
- Mute
- Subscribe to RSS Feed
- Permalink
- Notify Moderator
@ValeryOchkov wrote:
It is very interesting problem: it's symbolic solution get us not correct answer in Mathcad? Maple and Mathematica!
I remember that you posted that problem once or twice in our forum 😉
But, sorry, it has nothing to do with the discussion here in this thread (other than that a plot of a completetly different implicit function is involved).
- Mark as New
- Bookmark
- Subscribe
- Mute
- Subscribe to RSS Feed
- Permalink
- Notify Moderator
Here is a brute force attack to turn the list of line segments returned by implicit2D into an ordered list of points.
It seems to work pretty well with simple close curves like the ones being treated here. So you can try to fit your B-splines.
But my approach fails badly if the curves are more complicated, consist of separated branches, etc., as you can see at the two last examples in the sheet.
- Mark as New
- Bookmark
- Subscribe
- Mute
- Subscribe to RSS Feed
- Permalink
- Notify Moderator
- Mark as New
- Bookmark
- Subscribe
- Mute
- Subscribe to RSS Feed
- Permalink
- Notify Moderator
How does this question apply to this old thread? 😉
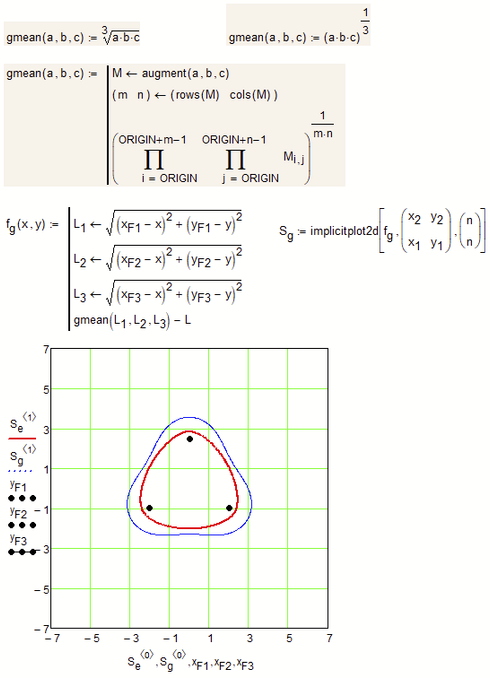
Its an error which has to do with the way "gmean" (and also "hmean") is implemented in Mathcad.
As a workaround you may redefine those functions (for the use with exactly three arguments). I tried it in three different ways and all of them work OK.
The last one isn't the preferred one, but its just an attempt to directly simulate the formula given in the help.
Be aware that the MC15 help has an error in that formula (but the implementation is OK) and this error is even fixed in the Prime help (wow, surprise!).
- Mark as New
- Bookmark
- Subscribe
- Mute
- Subscribe to RSS Feed
- Permalink
- Notify Moderator
I found the reason for this error.
One of your lengths you calculate the mean may be zero and neither "gmean" nor "hmean" accept 0 as an argument. Allowed are only positive values.
There is no reason for this limitation in "gmean" and even "hmean" could be rewritten (at least for a distinct number of scalar arguments 😞
Instead of redefining "gmean" and "hmean" you may also change your functions like this
- Mark as New
- Bookmark
- Subscribe
- Mute
- Subscribe to RSS Feed
- Permalink
- Notify Moderator
Sorry for asking again.Maybe I didn't learn well...
I need to plot something similar to the last one, but this time (for me ;)) it is more difficult...
- Mark as New
- Bookmark
- Subscribe
- Mute
- Subscribe to RSS Feed
- Permalink
- Notify Moderator
@Stoledano wrote:
Sorry for asking again.Maybe I didn't learn well...
I need to plot something similar to the last one, but this time (for me ;)) it is more difficult…
Mayby it will be help:
- Mark as New
- Bookmark
- Subscribe
- Mute
- Subscribe to RSS Feed
- Permalink
- Notify Moderator
You just need an equation for lambda, which fortunately mathcad can provide for you with symbolics. Then it's just like the previous examples (which I won't perform for you since the example has been provided, i.e. those with the implicit2d function)
- Mark as New
- Bookmark
- Subscribe
- Mute
- Subscribe to RSS Feed
- Permalink
- Notify Moderator
@Stoledano wrote:
Sorry for asking again.Maybe I didn't learn well...
I need to plot something similar to the last one, but this time (for me ;)) it is more difficult...
You just provide some, on first sight, unrelated formulas, provide a picture of a plot which does not show which quantities you apply on the respective axes and you expect us to put together all the missing information?
DJF seems to have polished his crystal ball and collected the loose ends correctly.
If you don't show, which way you wanted to go and where you failed its hard to help.
You never commented on the various suggestions to solve your first problem so we cannot know which approach you gave a try.
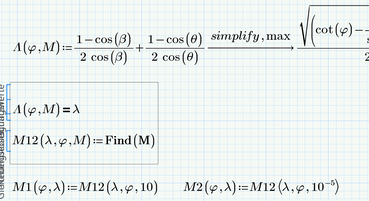
You marked the suggestion with the upper and lower half of the curves as being the "solution", so we can conclude that this is the approach which you liked most. A similar approach can be applied here, too. You will not succeed in solving the equation for M, but you can use a solve block to do so. Depending on the guess value you get a point on the upper half or the lower half (M1 and M2 in the picture below).
I gave it a try and it worked, but nevertheless I'd prefer the approach using uno's "implicitplt2D", as its faster and more versatile. But you get the result you are looking for with both methods. Guess you can forget about the 3D-contourplot approach because 3Dplots in Prime really are too mediocre.
- Mark as New
- Bookmark
- Subscribe
- Mute
- Subscribe to RSS Feed
- Permalink
- Notify Moderator
So what's the best way to get the area inside one of these (or similar) closed curves?
- Mark as New
- Bookmark
- Subscribe
- Mute
- Subscribe to RSS Feed
- Permalink
- Notify Moderator
@DJF wrote:
So what's the best way to get the area inside one of these (or similar) closed curves?
I think the Monte Carlo method, if numerical.
- Mark as New
- Bookmark
- Subscribe
- Mute
- Subscribe to RSS Feed
- Permalink
- Notify Moderator
@DJF wrote:
So what's the best way to get the area inside one of these (or similar) closed curves?
Why?
One possible way is shown in the pic below. The method to find the rightmost phi value is a bit shaky, to say the least. Improvements welcome.
Really would like to see the Monte Carlo you suggested in action using the very implicit function(s) in discussion here (and without using my M1, M2 functions 😉 Give it a try!
- Mark as New
- Bookmark
- Subscribe
- Mute
- Subscribe to RSS Feed
- Permalink
- Notify Moderator
Ok, here's my take on area calculations. First I had to create some tools to sort the Implicit2D output into unique points and then sort them into order. I used nearest-neighbor approach which won't always work. Then I calculated area using trapezoidal rule. Then for fun I added some b-splines through them. And to be complete I did one Monte Carlo area calculation.
5.0 and pdfs attached.
- Mark as New
- Bookmark
- Subscribe
- Mute
- Subscribe to RSS Feed
- Permalink
- Notify Moderator
Nice approach!
You may consider turning the single calculations into utility functions so you don't have to copy them again and again for different examples.
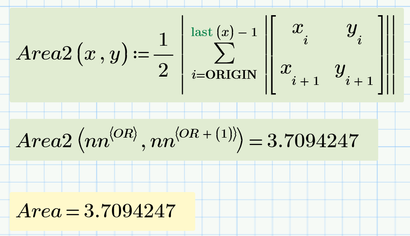
Here's a slightly simpler way to determine the area of a polygon:
- Mark as New
- Bookmark
- Subscribe
- Mute
- Subscribe to RSS Feed
- Permalink
- Notify Moderator
I just gave it a try and you could also use the "Connect" function I posted earlier -> here
The results of the two methods come closer if we increase the grid size for implicit2d. Here's the result with nx=ny=500


