Community Tip - Your Friends List is a way to easily have access to the community members that you interact with the most! X
- Subscribe to RSS Feed
- Mark Topic as New
- Mark Topic as Read
- Float this Topic for Current User
- Bookmark
- Subscribe
- Mute
- Printer Friendly Page
Plotting boxes in 3D
- Mark as New
- Bookmark
- Subscribe
- Mute
- Subscribe to RSS Feed
- Permalink
- Notify Moderator
Plotting boxes in 3D
Hi everyone!
I am trying to find a better solution (working for many more "boxes") for the problem exemplified in the attachment. I have a list of "boxes", defined in a matrix of X,Y,Z coordinates. I would like to get a 3D representation of the boxes. What I have attached works, of course, but it would be much better if one could represent the "walls" of the boxes, without all the points inside. Is this too much for MathCAD? what do you think?
Thanks a lot for any hints!
Regards
Claudio
Solved! Go to Solution.
Accepted Solutions
- Mark as New
- Bookmark
- Subscribe
- Mute
- Subscribe to RSS Feed
- Permalink
- Notify Moderator
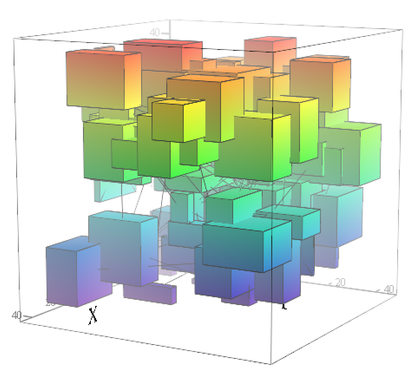
Here is my second attempt. This time all boxes represent just one single plot, but the boxes are now connected by a line which is of course disturbing. Only way to get rid of this is to do without potting the wireframe lines.
But at least you won't run into some kind of limitations and don't have to go through the hassle of having to format the style of every box at its own. See here a sample plot with 100 random boxes:
- Mark as New
- Bookmark
- Subscribe
- Mute
- Subscribe to RSS Feed
- Permalink
- Notify Moderator
I guess you would have to dig into
Still the bible when it comes to plotting in Mathcad
- Mark as New
- Bookmark
- Subscribe
- Mute
- Subscribe to RSS Feed
- Permalink
- Notify Moderator
Hey Werner, thanks! I wasn't aware of this. The E-book is really the exe-file attached to the post? it is somehow an unusual format ...
Regards
Claudio
- Mark as New
- Bookmark
- Subscribe
- Mute
- Subscribe to RSS Feed
- Permalink
- Notify Moderator
Distributing E-Books as self exctracting archives wasn't unusual at those times. The exe would extract the files in the (Mathcad 14, you would have to edit the path) handbook directory.
If you feel uncomfortable with an exe, here is the handbook unpacked and rezipped. You woul have to unzip it in the correct directory yourself.
An be prepared for some hardcore stuff 😉
- Mark as New
- Bookmark
- Subscribe
- Mute
- Subscribe to RSS Feed
- Permalink
- Notify Moderator
You might also be interested in the article of uni (Viacheslav N. Mezentsev ) - see the last post in this thread:
Its in russian but the pictures of the first few pages should give you a hint how to create a box.
- Mark as New
- Bookmark
- Subscribe
- Mute
- Subscribe to RSS Feed
- Permalink
- Notify Moderator
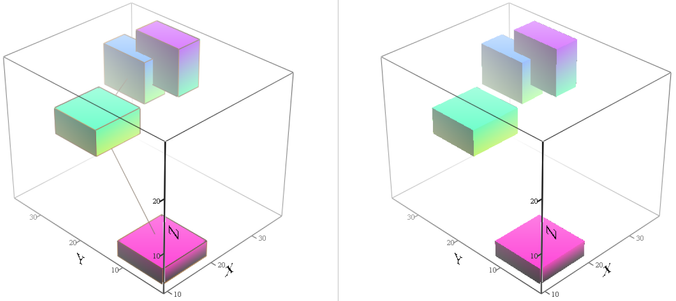
Here is my first attempt using some data structure from the "amazing images".
Unfortunately it creates a separate plot for each box which may make you run into some limitation if you'd like to plot a lot of boxes (apart from having to set the appearance for each box in an extra step.
In the E-book there are routines which can make it just one single plot (if you have the time to dig into and experiment).
- Mark as New
- Bookmark
- Subscribe
- Mute
- Subscribe to RSS Feed
- Permalink
- Notify Moderator
Here is my second attempt. This time all boxes represent just one single plot, but the boxes are now connected by a line which is of course disturbing. Only way to get rid of this is to do without potting the wireframe lines.
But at least you won't run into some kind of limitations and don't have to go through the hassle of having to format the style of every box at its own. See here a sample plot with 100 random boxes:
- Mark as New
- Bookmark
- Subscribe
- Mute
- Subscribe to RSS Feed
- Permalink
- Notify Moderator
I wish to thank you very much, Werner, both for making me aware of the "Amazing Images" E-Book (it works! 🙂 and for even programming the requested solution for me! I certainly had required more time! I was still wondering at the book ...
Regards and thanks a lot again
Claudio
- Mark as New
- Bookmark
- Subscribe
- Mute
- Subscribe to RSS Feed
- Permalink
- Notify Moderator
@ClaudioPedrazzi wrote:
I wish to thank you very much, Werner, both for making me aware of the "Amazing Images" E-Book (it works! 🙂 and for even programming the requested solution for me! I certainly had required more time! I was still wondering at the book ...
Regards and thanks a lot again
Claudio
In this E-Book you sure will find a lot to wonder about - its not easy stuff.
I thought that it should be able to plot the boxes without any connection line between, but when I look now again at the "Amazing Images", chapter 3.9, example 6, second plot, I also see connection lines. So I guess its not possible to separate the boxes completely while retaining them all in one plot. Main problem is, that in 3D we can't use NaN's to separate different boxes as we could do in a 2D plot. We can use NaN's in 3D plots in Prime, but I sure would not propagate Prime to be used for 3D plots. After all, I wouldn't propagate to use Prime at all.


