Community Tip - Visit the PTCooler (the community lounge) to get to know your fellow community members and check out some of Dale's Friday Humor posts! X
- Subscribe to RSS Feed
- Mark Topic as New
- Mark Topic as Read
- Float this Topic for Current User
- Bookmark
- Subscribe
- Mute
- Printer Friendly Page
Plotting failed. Replace complex values and NaNs by real numbers. Mathcad14 and Prime 3.0
- Mark as New
- Bookmark
- Subscribe
- Mute
- Subscribe to RSS Feed
- Permalink
- Notify Moderator
Plotting failed. Replace complex values and NaNs by real numbers. Mathcad14 and Prime 3.0
Hello,
I'm starting my adventure with Mathcad.
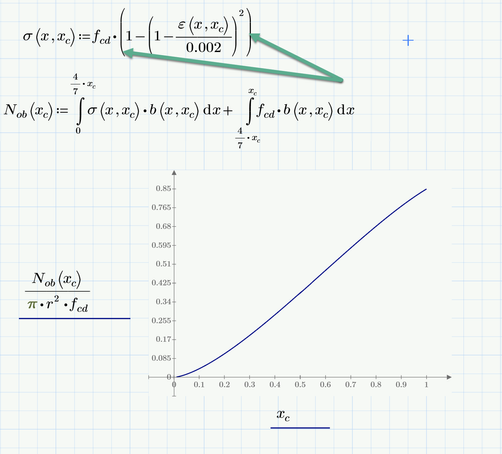
I have two the same files written in Mathcad 14 and Mathcad Prime 3.0.But it only works well in Mathcad 14 and I don't understand why.
In Prime 3.0 when i trying to plot the graph i have: "Plotting failed. Replace complex values and NaNs by real numbers."
I noticed that there are many people with similar problems. I have read all topics related to it and I still don't know what is wrong with my file.
Can you help me?
Solved! Go to Solution.
- Labels:
-
Mathcad Usage
Accepted Solutions
- Mark as New
- Bookmark
- Subscribe
- Mute
- Subscribe to RSS Feed
- Permalink
- Notify Moderator
Never type square brackets unless you really intend to create a matrix/vector. Otherwise type parenthesis only! Sometimes in real Mathcad and even in Prime they may be displayed as square brackets, but even you should never type square brackets yourself. In real Mathcad its not possible to enter that trap as typing "[" always will create a vector/matrix index, but in Prime after a multiplication dot it creates a matrix/vector.
- Mark as New
- Bookmark
- Subscribe
- Mute
- Subscribe to RSS Feed
- Permalink
- Notify Moderator
Thank you! All clear.
I didn't know that the brackets are so important...
I have one more question:
How can I move this graph to Excel? For matching.
- Tags:
- U
- Mark as New
- Bookmark
- Subscribe
- Mute
- Subscribe to RSS Feed
- Permalink
- Notify Moderator
Take a screenshot and paste it onto the Excel worksheet.
Better: Take your data from Excel to Prime and plot it along with the Prime data.
Success!
Luc
- Mark as New
- Bookmark
- Subscribe
- Mute
- Subscribe to RSS Feed
- Permalink
- Notify Moderator
@Nykus wrote:
Thank you! All clear.
I didn't know that the brackets are so important...
I have one more question:
How can I move this graph to Excel? For matching.
Do you mean transferring the data to Excel and recreate the plot there?
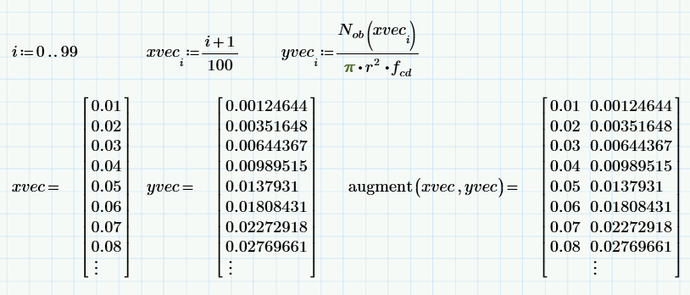
You may create vectors for x an y in Prime and either manually copy the values to your Excel sheet or use an Excel component to do so or use the function WRITEEXCEL to do the job.
EDIT: copy and paste works pretty well in real Mathcad but as usual fails in Prime. So you are limited to the other two methods or export the data to a text file using WRITETEXT("C:\TestFile.txt", augment(xvec,yvec)). You may also use WRITEPRN or WRITECSV, but WRITETEXT seems to be less painful when it comes to copy and paste.
Remarks:
1) Note that the indices used are vector/matrix indices (created by typing "[") and not literal indices (created by typing "Ctrl -").
2) Your function N.ob fails at x=0 as of a division by zero. Thats the reason for the "i+1" and range only running up to 99 and not 100.
- Mark as New
- Bookmark
- Subscribe
- Mute
- Subscribe to RSS Feed
- Permalink
- Notify Moderator


