Community Tip - New to the community? Learn how to post a question and get help from PTC and industry experts! X
- Subscribe to RSS Feed
- Mark Topic as New
- Mark Topic as Read
- Float this Topic for Current User
- Bookmark
- Subscribe
- Mute
- Printer Friendly Page
Toolbox: Text plotting
- Mark as New
- Bookmark
- Subscribe
- Mute
- Subscribe to RSS Feed
- Permalink
- Notify Moderator
Toolbox: Text plotting
Attached is a Prime 4 file that allows you to plot text in a graph, like:
Of course it runs in Prime Express...
Enjoy!
Luc
Solved! Go to Solution.
- Labels:
-
Mathcad Usage
Accepted Solutions
- Mark as New
- Bookmark
- Subscribe
- Mute
- Subscribe to RSS Feed
- Permalink
- Notify Moderator
Hi Werner,
Thanks for pointing that out. I think it's corrected now.
Luc
- Mark as New
- Bookmark
- Subscribe
- Mute
- Subscribe to RSS Feed
- Permalink
- Notify Moderator
Thanks!
- Mark as New
- Bookmark
- Subscribe
- Mute
- Subscribe to RSS Feed
- Permalink
- Notify Moderator
Very neat, Luc. Concise, too.
Stuart
- Mark as New
- Bookmark
- Subscribe
- Mute
- Subscribe to RSS Feed
- Permalink
- Notify Moderator
- Mark as New
- Bookmark
- Subscribe
- Mute
- Subscribe to RSS Feed
- Permalink
- Notify Moderator
I don't know. Prerequisite is that you have access to the full functionality of Prime. I'm limited to Express...
The text plotting functions create matrices of many rows and two columns. I think that for 3D plotting you'd need 3 columns. Now it's easy to augment the matrix with another row. Suppose T is the output of a text plotting function then you could add the third column with:
T:= augment(T,update1(0,last(T),0)+z)
to position your text on the x-y plane at elevation z.
The other thing is that the T will contain NaN values. I don't know if the 3D plots will accept them.
Success!
Luc
P.S. The better way to create the z-coordinates may be:
Which will preserve the NaN values.
- Mark as New
- Bookmark
- Subscribe
- Mute
- Subscribe to RSS Feed
- Permalink
- Notify Moderator
The other thing is that the T will contain NaN values. I don't know if the 3D plots will accept them.
While the 3D plot in Prime in no way can live up to that in real Mathcad, it has at least the advantage of accepting NaN's like the 2D plot in Mathcad does.
- Mark as New
- Bookmark
- Subscribe
- Mute
- Subscribe to RSS Feed
- Permalink
- Notify Moderator
@Werner_E wrote:
The other thing is that the T will contain NaN values. I don't know if the 3D plots will accept them.While the 3D plot in Prime in no way can live up to that in real Mathcad, it has at least the advantage of accepting NaN's like the 2D plot in Mathcad does.
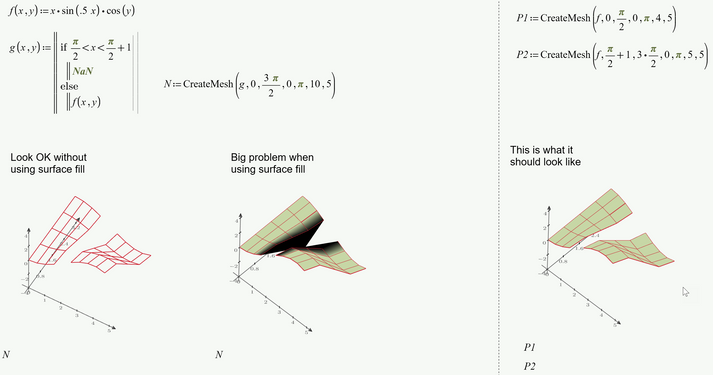
I do have a problem when joining multiple meshes, though. I can't work out why there's a dark banding where the NaNs live.
The MP7 variables hold 3D meshes. vector p holds the first 4 numbers in Tetsuro's 3D Plot argument list.
Stuart
(I was playing around with Tetsuro's worksheet to allow a vector of meshes as an argument to the 3D Plot component. The function meshmerge takes such a vector and places NaNs between each mesh to create a single mesh. It works on vectors of both 3-column xyz coordinate lists and of xyz planes)
- Mark as New
- Bookmark
- Subscribe
- Mute
- Subscribe to RSS Feed
- Permalink
- Notify Moderator
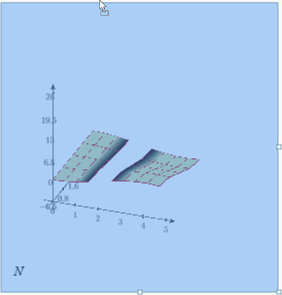
Thats what I see in P6 (exchanging the NaN's for the imaginary unit 1j did not help and yields the same plot)
- Mark as New
- Bookmark
- Subscribe
- Mute
- Subscribe to RSS Feed
- Permalink
- Notify Moderator
@Werner_E wrote:
Thats what I see in P6 (exchanging the NaN's for the imaginary unit 1j did not help and yields the same plot)
Interesting. It would seem they project to some point on the backplane (they certainly don't project along the surface normals). I wonder why they're black and grade into the yellow surface? Neither the surface fill nor the line colour is black.
That's a nuisance and somewhat restricts the technique's usefulness. I wonder if they can put a patch in before Prime 8 gets released? And add colormaps? (I love rhetorical questions ... 😈)
Sadly, either because I'm going blind or it's not there, I can't see any mention of Plot component improvements on the Roadmap.
https://community.ptc.com/t5/PTC-Mathcad/PTC-Mathcad-Prime-Roadmap-2021-update/m-p/738684
Stuart
- Mark as New
- Bookmark
- Subscribe
- Mute
- Subscribe to RSS Feed
- Permalink
- Notify Moderator
I suppose some kind of improvement is already there, going from Werner's Prime 6, apparently showing that NaN is out there somewhere and the plot reaches out to it, to your Prime 7, where NaN's are some kind of black hole, the position of which is indeterminate...
What would you want Prime 8 to do further with it?
Luc
- Mark as New
- Bookmark
- Subscribe
- Mute
- Subscribe to RSS Feed
- Permalink
- Notify Moderator
@LucMeekes wrote:
I suppose some kind of improvement is already there, going from Werner's Prime 6, apparently showing that NaN is out there somewhere and the plot reaches out to it, to your Prime 7, where NaN's are some kind of black hole, the position of which is indeterminate...
What would you want Prime 8 to do further with it?
Luc
Yes, that's definitely an improvement.
However, was it intentional or just a side-effect of some other change? If the former, why wasn't the colour gradation dealt with?
What would you want Prime 8 to do further with it?
Treat NaNs as a complete break in the surface, which is what they do for a non-filled mesh. So, a filled surface would not have "NaN edge gradation". Either that or revert to using & plotting nested 3D-meshes to handle objects with multiple surfaces.
It goes without saying that I want colormaps. I'd also like to be able to set independent depth ranges for each plot entry (to address such cases as @-MFra- 's contour-mapped sliding surface ... or to have depth-positionable contour maps).
I had a list somewhere or other...
Stuart
Her's one such list: https://community.ptc.com/t5/PTC-Mathcad/New-Feature-requests/m-p/356451/highlight/true#M139515
add plot component programming interface:
... allow component to return complete parameter set (eg, as one nested array or by specific functions)
... allow user to programmatically set parameters (eg, pass back complete parameter set or by specific function)
... add capability to return plot image
... add capability to return plot data (eg, surface co-ordinates)
... see threads: (no longer exist as they weren't transferred over from the old Collaboratory)
The list is quite old and a few of the features are obsolete or irrelevant, but most are still valid, I think.
- Mark as New
- Bookmark
- Subscribe
- Mute
- Subscribe to RSS Feed
- Permalink
- Notify Moderator
Interesting. It would seem they project to some point on the backplane (they certainly don't project along the surface normals).
That "center of projection" changes when I change the axis limits. It seems to be the center of the surrounding box.
Looks like they improved the shading algorithm a little bit when they went from P6 to P7.
I wonder if they can put a patch in before Prime 8 gets released? And add colormaps? (I love rhetorical questions ... 😈)
Just be careful with your wishes! We wished they would improve 2D plotting an we got ... a badly integrated third party tool which does not support units and has a lot of other drawbacks.
- Mark as New
- Bookmark
- Subscribe
- Mute
- Subscribe to RSS Feed
- Permalink
- Notify Moderator
@Werner_E wrote:
Interesting. It would seem they project to some point on the backplane (they certainly don't project along the surface normals).That "center of projection" changes when I change the axis limits. It seems to be the center of the surrounding box.
Looks like they improved the shading algorithm a little bit when they went from P6 to P7.
Thanks. I thought that might be the case, but it's difficult to be certain from an image.
I wonder if they can put a patch in before Prime 8 gets released? And add colormaps? (I love rhetorical questions ... 😈)Just be careful with your wishes! We wished they would improve 2D plotting an we got ... a badly integrated third party tool which does not support units and has a lot of other drawbacks.
Tell me about it. ☹️
@RichardJ wrote:
Stuart Bruff
I'm not normally paranoid, but I'm beginning to think they do these things just to annoy me.
You are not paranoid. They do
- Mark as New
- Bookmark
- Subscribe
- Mute
- Subscribe to RSS Feed
- Permalink
- Notify Moderator
- Mark as New
- Bookmark
- Subscribe
- Mute
- Subscribe to RSS Feed
- Permalink
- Notify Moderator
Here is something strange (sligthtly off-topic) which I found while (unsuccessfully) playing around.
Is it a new unknown "unit"? At least its labelled as such. 😉
In real Mathcad the result is simply NaN, as it should be IMHO.
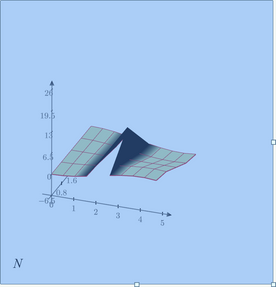
OK, coming back to the topic (not the topic of the thread but that of the last discussions) I created this test sheet with a function returning NaN's in a specific region. The effect unfortunately is the same:
I noticed that while a move the region around with pressed left mouse button, the projection lines disappear:
The black shades which you see in P7 still are there and as soon as the left mouse button isn't pressed anymore, the projection lines magically reappear:
It looks like I was wrong and too hasty when I said that Prime would have the advantage over Mathcad to accept NaN's in the 3D plot 😞
- Mark as New
- Bookmark
- Subscribe
- Mute
- Subscribe to RSS Feed
- Permalink
- Notify Moderator
The unit NaNi is not only unknown, it's also undefined:
Together with the double negation in the exponent of 10, this is a sign of serious trouble that should be reported to the officials!
Luc
- Mark as New
- Bookmark
- Subscribe
- Mute
- Subscribe to RSS Feed
- Permalink
- Notify Moderator
@LucMeekes wrote:
The unit NaNi is not only unknown, it's also undefined:
Together with the double negation in the exponent of 10, this is a sign of serious trouble that should be reported to the officials!
Of course I tried evaluating NaNi, too, and also found that its not defined 😉
Well, maybe this bug should be reported, but if PTC would be seriously interested in reported bugs, there would be an easy way to report them, regardless of whether you were paying for a licensed version, or are just using the evaluation version or the free express edition. There possibly would also be a sub-forum here in the forum, where bugs could be reported in an uncomplicated manner.
All that is not the case. But lately the Mathcad forum seems to have been taken notice of occasionally by PTC staff - maybe bugs reported here are being taken care of, who knows.
- Mark as New
- Bookmark
- Subscribe
- Mute
- Subscribe to RSS Feed
- Permalink
- Notify Moderator
@LucMeekes wrote:
The unit NaNi is not only unknown, it's also undefined:
Together with the double negation in the exponent of 10, this is a sign of serious trouble that should be reported to the officials!
Luc
The bug was still present in Prime 9 but seems to be fixed in Prime 10 - At least it is in 10.0.1.0
- Mark as New
- Bookmark
- Subscribe
- Mute
- Subscribe to RSS Feed
- Permalink
- Notify Moderator
It's solved in Prime 10.0.0.0:
Luc
- Mark as New
- Bookmark
- Subscribe
- Mute
- Subscribe to RSS Feed
- Permalink
- Notify Moderator
@LucMeekes If you could share another 3D Plot Function Sheet , it's the best.
that can apply in construction Text in 3D Modeling as picture below or in general
- Mark as New
- Bookmark
- Subscribe
- Mute
- Subscribe to RSS Feed
- Permalink
- Notify Moderator
Using image data to plot the numbers by dots.
- Mark as New
- Bookmark
- Subscribe
- Mute
- Subscribe to RSS Feed
- Permalink
- Notify Moderator
@ttokoro when I change ORIGIN=1 not working well and number more than 9 it not appear that number
- Mark as New
- Bookmark
- Subscribe
- Mute
- Subscribe to RSS Feed
- Permalink
- Notify Moderator
- Mark as New
- Bookmark
- Subscribe
- Mute
- Subscribe to RSS Feed
- Permalink
- Notify Moderator
now, n=0 to 99 you can 3D plot. If you want to change the ORIGIN to 1, you should change the program.
- Mark as New
- Bookmark
- Subscribe
- Mute
- Subscribe to RSS Feed
- Permalink
- Notify Moderator
- Mark as New
- Bookmark
- Subscribe
- Mute
- Subscribe to RSS Feed
- Permalink
- Notify Moderator
- Mark as New
- Bookmark
- Subscribe
- Mute
- Subscribe to RSS Feed
- Permalink
- Notify Moderator
- Mark as New
- Bookmark
- Subscribe
- Mute
- Subscribe to RSS Feed
- Permalink
- Notify Moderator
Nice.
- Mark as New
- Bookmark
- Subscribe
- Mute
- Subscribe to RSS Feed
- Permalink
- Notify Moderator
@ttokoro that great , could you do for general for input Letter or Number no limit (not only 1 to 99)?
Best regard SPRStructure
- Mark as New
- Bookmark
- Subscribe
- Mute
- Subscribe to RSS Feed
- Permalink
- Notify Moderator
Using Luc's function, all letters and numbers you can plot as shown in my post at 01-04-2022 11:14 AM.


