Community Tip - When posting, your subject should be specific and summarize your question. Here are some additional tips on asking a great question. X
- Subscribe to RSS Feed
- Mark Topic as New
- Mark Topic as Read
- Float this Topic for Current User
- Bookmark
- Subscribe
- Mute
- Printer Friendly Page
Unable to plot inverse laplace transform waveform
- Mark as New
- Bookmark
- Subscribe
- Mute
- Subscribe to RSS Feed
- Permalink
- Notify Moderator
Unable to plot inverse laplace transform waveform
Hi
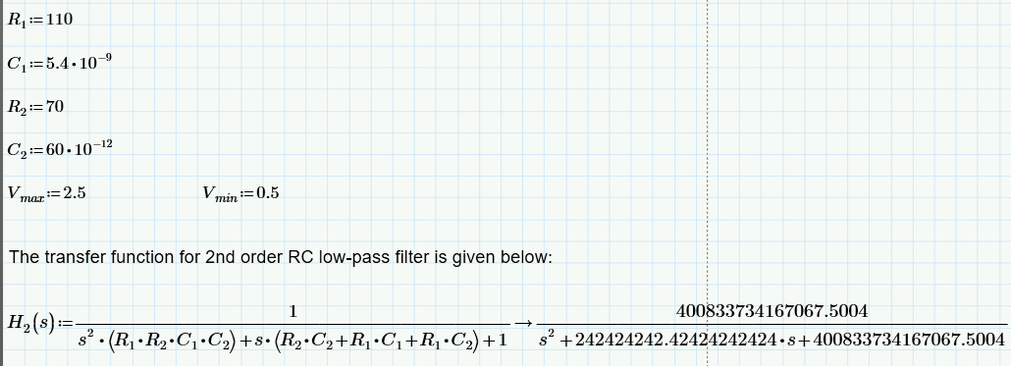
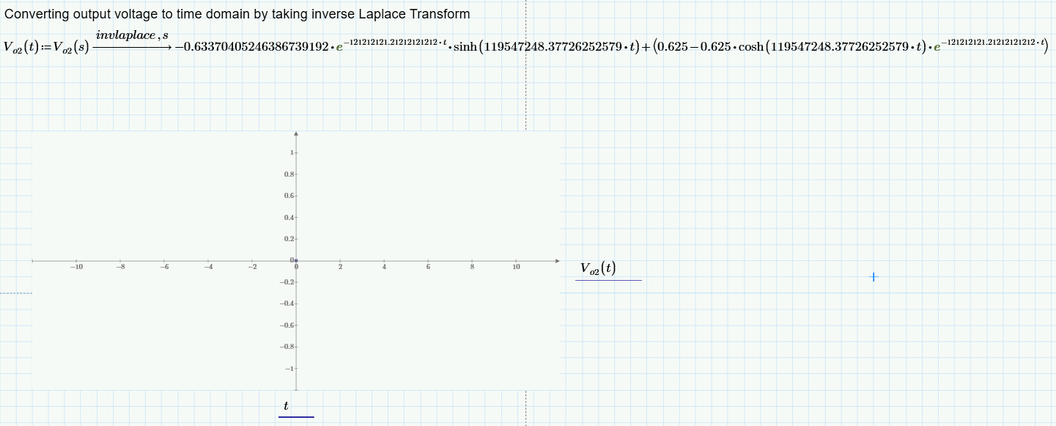
Please find the attached mathcad prime worksheet. I am trying to plot Vo(t) vs t. An error stating "Plotting failed. Replace complex numbers and NaNs by real numbers is showing. Kindly help me to resolve this issue.
Solved! Go to Solution.
- Labels:
-
Calculus_Derivatives
-
Mathcad Usage
Accepted Solutions
- Mark as New
- Bookmark
- Subscribe
- Mute
- Subscribe to RSS Feed
- Permalink
- Notify Moderator
I am using Mathcad Prime 8. From Prime 7, Laplace and Fourier transforms are version upped. You can read PDF of my file.
Anyway, h(t) is almost impulse, and the response is as same as input signal. Using convolution technique by * in Mathcad, the signal delay is about 3 microseconds.
Tokoro.
- Mark as New
- Bookmark
- Subscribe
- Mute
- Subscribe to RSS Feed
- Permalink
- Notify Moderator
As you can see the result of invlaplace contains limit operators (n->infinity). These limits can only be evaluated symbolically but a plot requires numeric evaluations. So the plot must fail.
Try yourself and type V.o(0.3)= and Prime will fail with an appropriate error message.
After all this means that Primes symbolic is not capable enough to find a decent representation of the inverselaplace transfomed. The result Primes symbolics returns is useless, it can't neither be evaluated symbolically nor numerically.
- Mark as New
- Bookmark
- Subscribe
- Mute
- Subscribe to RSS Feed
- Permalink
- Notify Moderator
- Mark as New
- Bookmark
- Subscribe
- Mute
- Subscribe to RSS Feed
- Permalink
- Notify Moderator
@SU_10542991 wrote:
Thank you for the response. I have checked Vo(0.3) and it is showing error. I understood that the limit operator (n-->infinity) is the issue. Is there any way to resolve this issue?
Actually the limit operator is also not helpful if you try to symbolically evaluate Vo(0.3) as the result of Primes symbolic is just kind of a building plan how to derive the invlaplace transformed if, yes if we could simplify that derivation limit.
It just means that Prime is not capable enough to give you the answer you are asking for.
I tried with the legacy symbolic engine which is available up to Prime 6 and it wasn't able to come up with a solution function either
(but it shows that a bit more clearly that its not capable enough):
So at the moment I see no way to derive the output voltage using invlaplace with Prime.
- Mark as New
- Bookmark
- Subscribe
- Mute
- Subscribe to RSS Feed
- Permalink
- Notify Moderator
- Mark as New
- Bookmark
- Subscribe
- Mute
- Subscribe to RSS Feed
- Permalink
- Notify Moderator
No, the legacy symbolic engine (muPad) was the engine in real Mathcad 14 and 15 and also in Prime 1 - 6.
Prime 6 was the first version which included the new engine (where PTC doesn't have to pay license fees and also has more control over its development) and Prime 6 also was the only version where you were able to switch between the two engines. Starting with Prime 7 the new engine is the only one available.
But as I said - the old engine wasn't able to find a function, too.
In real Mathad 11 the symbolic engine was a stripped down version of Maple and this was the best symbolic engine implemented in Mathcad ever. Not sure if @LucMeekes would be willing to give it try as he is still using this version of Mathcad.
- Mark as New
- Bookmark
- Subscribe
- Mute
- Subscribe to RSS Feed
- Permalink
- Notify Moderator
@SU_10542991
If it can help something or if further others colleagues come with other ideas starting from here::
Mathcad Prime 7 file attached.
- Mark as New
- Bookmark
- Subscribe
- Mute
- Subscribe to RSS Feed
- Permalink
- Notify Moderator
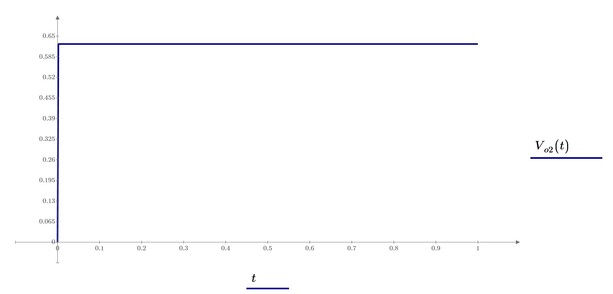
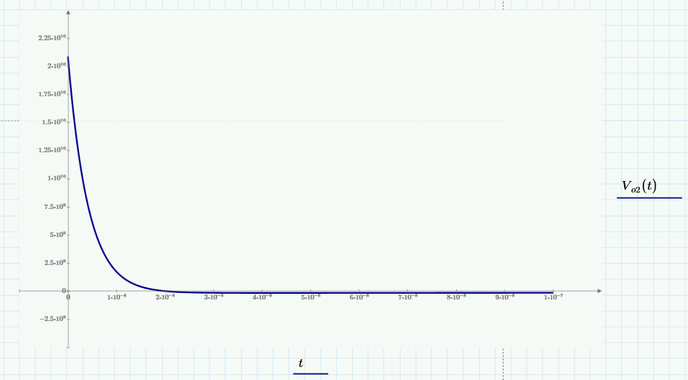
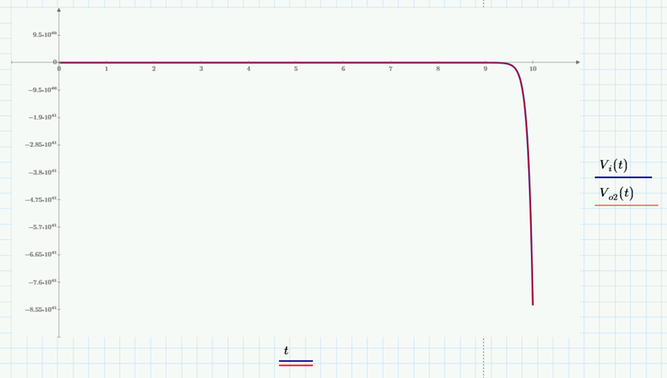
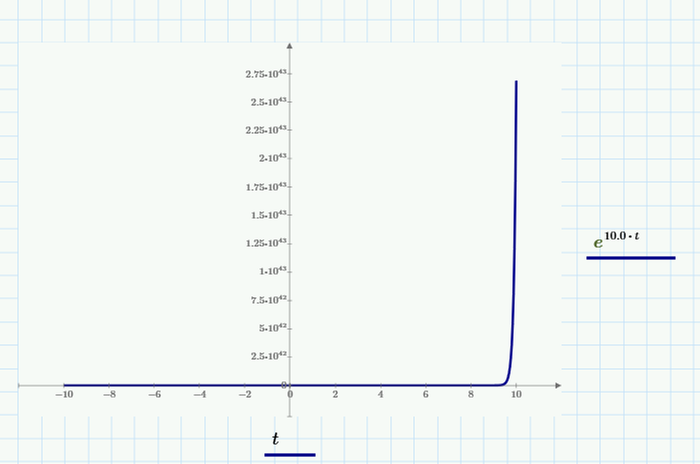
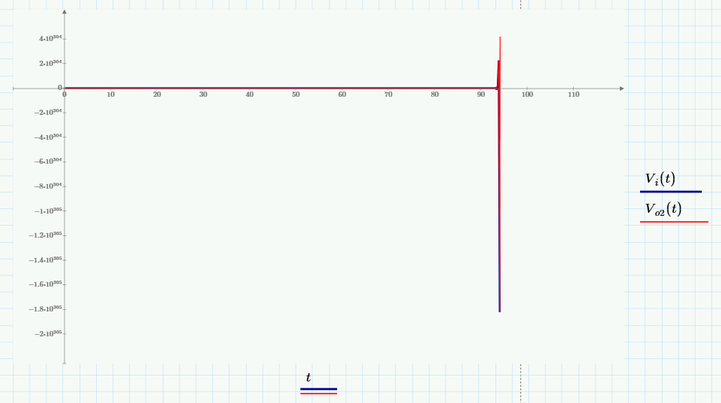
Hmmm, the argument for sinh in your V.o2 is so large that for every value of t (other than t=0) we have an overflow (value greater than 10^308). Thats the reason the plot consists of just one point at the origin.
I am not sure if linearizing the exponential functions give a meaningful result, but adding a "simplify" will at least make the whole thing plot:
- Mark as New
- Bookmark
- Subscribe
- Mute
- Subscribe to RSS Feed
- Permalink
- Notify Moderator
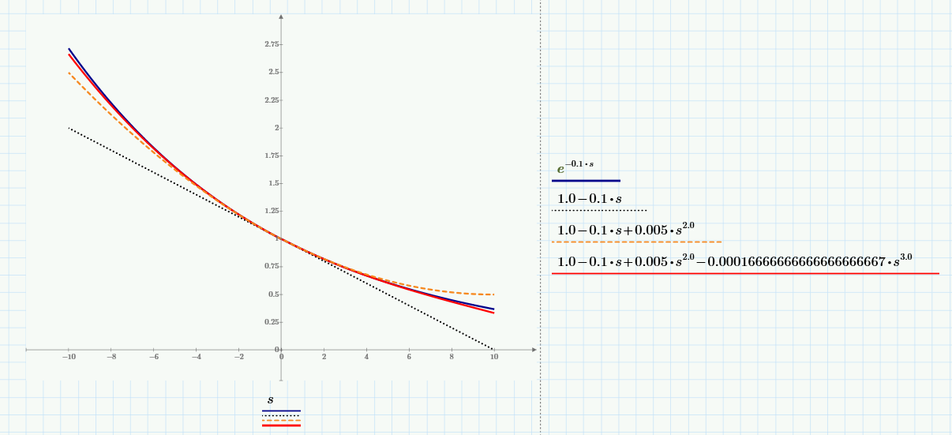
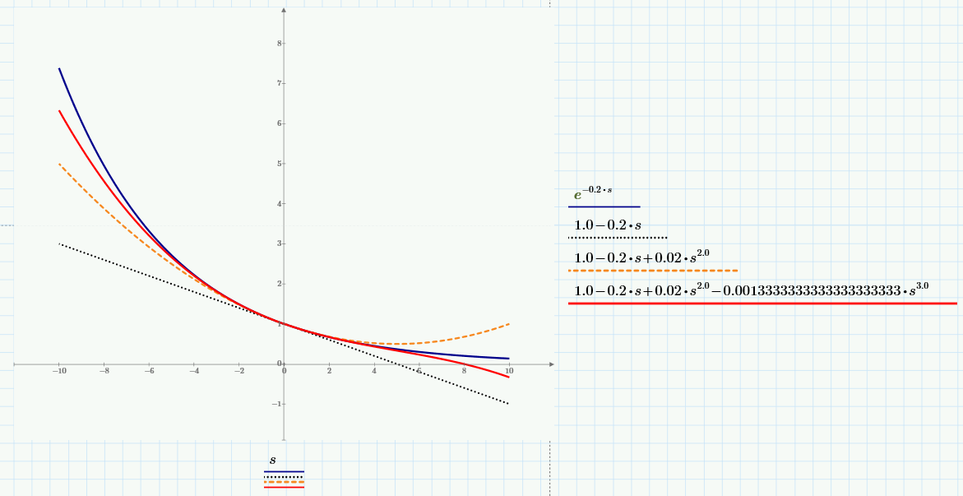
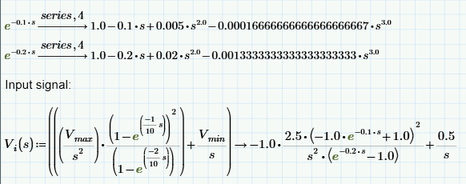
If we use series, 4 approximation (which seems to be a good approximation for e^-0.1*s and e^-0.2*s) then te result is:
Mathcad Prime 7 file attached.
- Mark as New
- Bookmark
- Subscribe
- Mute
- Subscribe to RSS Feed
- Permalink
- Notify Moderator
Thank you for the response @Werner_E .I discussed above, the issue I faced while plotting the Vi(s). Do you have any suggestion on this issue?
- Mark as New
- Bookmark
- Subscribe
- Mute
- Subscribe to RSS Feed
- Permalink
- Notify Moderator
Thank you for the response @Cornel. I tried using your methodology and it is working, the only issue was that as @Werner_E said in the below response that 10^308 error was showing. So, I used the simplify symbolic also, and then it is working. The same methodology I tried to take the inverse laplace transform of Vi(s), but the following is the error showing up: I don't understand why is this "s" term coming in the inverse laplace transform term. What does this delta(t) mean?
- Mark as New
- Bookmark
- Subscribe
- Mute
- Subscribe to RSS Feed
- Permalink
- Notify Moderator
Looks to me like the two "s" in the result of Vi2(s) are not labelled the same (a common bug in Prime).
Can't be told just from the pic, though.
- Mark as New
- Bookmark
- Subscribe
- Mute
- Subscribe to RSS Feed
- Permalink
- Notify Moderator
As @Werner_E wrote, it's probably about the fact that you don't have the same label for every s in your laplace equation. Some of the s in your equation have the label "Automatic", while others are likely labeled "Variable". But you must have the same label for all s of your equation (whichever label you want, you choose the label you want to use) to receive a correct answer. Always put a worksheet of Mathcad.
And I think the most likely correct answer to your problem is that in which you use series, 4 approximation because series, 4 approximation well approximates those exponential function, instead of series, 2 approximation.
@Werner_E @LucMeekes @ttokoro
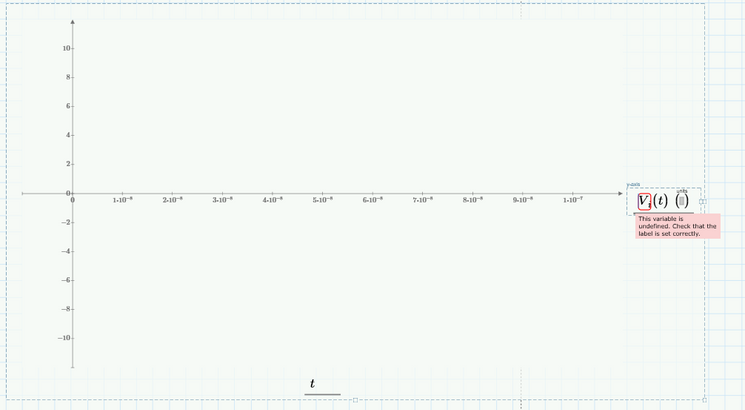
I think the problem with the fact that Vi(t) is not displayed, meaning that error occurs: "This variable is undefined. Check that the label is set correctly", is I think because we have to define that delta(t). How can we define this delta(t)?
Mathcad Prime 7 file attached.
- Mark as New
- Bookmark
- Subscribe
- Mute
- Subscribe to RSS Feed
- Permalink
- Notify Moderator
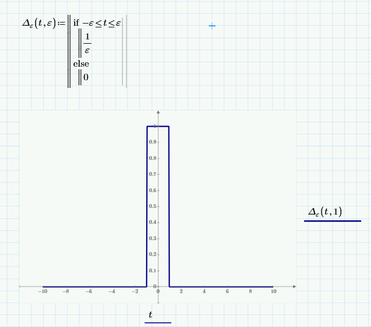
The Dirac unit impulse Delta(t) is a symbolic only function.
You may write approximating function (very narrow spike with area underneath=1). but I don't think that this would solve the problem here satisfactory.
https://support.ptc.com/help/mathcad/r8.0/en/#page/PTC_Mathcad_Help/diracdelta_functions.html
- Mark as New
- Bookmark
- Subscribe
- Mute
- Subscribe to RSS Feed
- Permalink
- Notify Moderator
I see the situation in principle like this: we should made a function by which we can use this delta(t) even numerically (not only symbolically), and then see what result gives Vi(t). But someone has to create this function through which we can use delta(t) even numerically...Maybe @ttokoro knows (idk), I do not know how to create this delta(t) in such a way so that I can use delta(t) numerically, in calculations.
- Mark as New
- Bookmark
- Subscribe
- Mute
- Subscribe to RSS Feed
- Permalink
- Notify Moderator
You may try the approximation given here and in the follow up posts and see, you arrive at a meaningful result here.
- Mark as New
- Bookmark
- Subscribe
- Mute
- Subscribe to RSS Feed
- Permalink
- Notify Moderator
Thank you.
@Werner_E @ttokoro @LucMeekes @SU_10542991
Case 1: Using series, 2 approximation:
Case 2: Using series, 3 approximation:
This is because of:
Case 2: Using series, 4 approximation:
This is because of:
And in the output we also can see:
So, Vi(s), Vi(t) is an unstable input as it is.
Only if we approximate those e^-0.1*s and e^-0.2*s with series, 2 approximation (so, with a linear expression) - series, 3 and series, 4 approximation are nonlinear expression - then Vi(s), Vi(t) and Vo2(s), Vo2(t) become a stable input and stable output.
Mathcad Prime 7 file attached.
- Mark as New
- Bookmark
- Subscribe
- Mute
- Subscribe to RSS Feed
- Permalink
- Notify Moderator
Hi @Cornel regarding label, it is automatic. I am not able to choose a label as you said.
- Mark as New
- Bookmark
- Subscribe
- Mute
- Subscribe to RSS Feed
- Permalink
- Notify Moderator
What is your Vi(t) ?
Have you tried transforming your input signal (Vi) alone to time domain?
Success!
Luc
- Mark as New
- Bookmark
- Subscribe
- Mute
- Subscribe to RSS Feed
- Permalink
- Notify Moderator
Hi @LucMeekes
I tried transforming the input signal Vi(s) alone to Vi(t). But it is showing error in plotting. I don't understand why while taking inverse laplace transform, "s" term is coming. And what does this delta(t) mean? Can you please correct me where I am wrong?
- Mark as New
- Bookmark
- Subscribe
- Mute
- Subscribe to RSS Feed
- Permalink
- Notify Moderator
I guess essentially I was asking: How did you come to the expression for the Laplace transform of your input signal?
Since it is not common to have/know only the Laplace transform. All in all this is assuming you're dealing with a real-world problem, and not some pure theoretic set-up.
The reason I'm asking is because that Vi(s) contains expression parts that are quite uncommon for the Laplace domain: the (1-exp(-a*s)) occur in signals with a step and staircase shapes.
Seems like your input signal is the double convolution of a box and a staircase.
Success!
Luc
- Mark as New
- Bookmark
- Subscribe
- Mute
- Subscribe to RSS Feed
- Permalink
- Notify Moderator
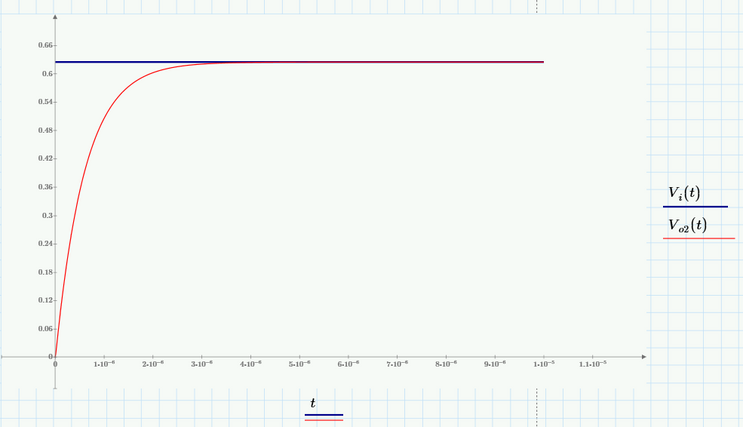
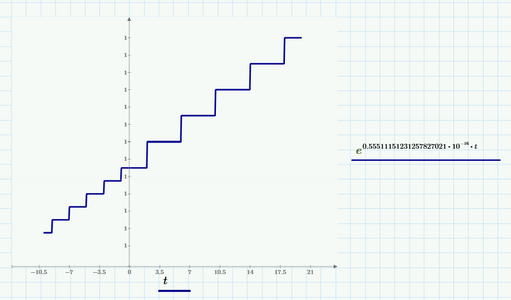
For example, we can see that in the case of series, 2 approximation, in Vo2(t) we receive a term that has staircase shape.
- Mark as New
- Bookmark
- Subscribe
- Mute
- Subscribe to RSS Feed
- Permalink
- Notify Moderator
- Mark as New
- Bookmark
- Subscribe
- Mute
- Subscribe to RSS Feed
- Permalink
- Notify Moderator
Maybe input signal is infinity number of triangle waves shown in green plot but that only shows 5 waves.
But cannot get Vout(t).
- Mark as New
- Bookmark
- Subscribe
- Mute
- Subscribe to RSS Feed
- Permalink
- Notify Moderator
Hi @ttokoro this is right. The input signal is a triangular wave. May I kindly know why you are saying that Vout will not be obtained.
- Mark as New
- Bookmark
- Subscribe
- Mute
- Subscribe to RSS Feed
- Permalink
- Notify Moderator


I think the time constant is so small and numerical calculation is failed.
- Mark as New
- Bookmark
- Subscribe
- Mute
- Subscribe to RSS Feed
- Permalink
- Notify Moderator
Hi
I am trying to plot the laplace transform Vi(s). I have derived this laplace transform of dc shifted triangular, which I suppose on take the inverse laplace transform and plotting should get a triangle waveform itself. But I am not getting it.
Also, in the previous response you have plotted vi(t). Here, I can see that you are not taking the "invlaplace" symbolic in mathcad and is defining vi(t). May I kindly know why you are doing like that?
I tried plotting the vi(t) equation as shown below but unable to plot v(2,t) like you did. Can you correct me? I want a triangular waveform ranging from 0.5V to 2.5V.
- Mark as New
- Bookmark
- Subscribe
- Mute
- Subscribe to RSS Feed
- Permalink
- Notify Moderator
Output voltage of the system.
After about 3 microsecond, output signal is as same as input voltage of infinity triangle train.
Prime 8 sheet attached.
- Mark as New
- Bookmark
- Subscribe
- Mute
- Subscribe to RSS Feed
- Permalink
- Notify Moderator
Hi @ttokoro Thank you for the response. I am unable to open this .mcdx file that you shared. It is saying that the file is not compatible with the current version. I am using Mathcad prime 7. I observed that the answers that you are getting by taking the invplaplce is not obtained when I am trying to do. This is what I am getting:
Is this difference because you are using a different version mathcad?
- Mark as New
- Bookmark
- Subscribe
- Mute
- Subscribe to RSS Feed
- Permalink
- Notify Moderator
I am using Mathcad Prime 8. From Prime 7, Laplace and Fourier transforms are version upped. You can read PDF of my file.
Anyway, h(t) is almost impulse, and the response is as same as input signal. Using convolution technique by * in Mathcad, the signal delay is about 3 microseconds.
Tokoro.

